The difference between the two is in the analysis of the 2010 to 2011 price pattern. The first possibility is that Primary W II in 2010 was a simple zig-zag which only lasted a few months from the Primary W I peak in late April, 2010 to an eventual low in early July, 2010. That low marked the start of a 7 1/2 year extended Primary W III which peaked this January. In this context we are now seeing Primary W IV unfold, and that wave should be wrapping up by the end of the year and be limited in price damage - at least as compares to the 2nd alternate described later. And of course another bull market in the form of Primary W V should ensue.
Alternate #1

The second possibility is that Primary W II was a running flat which didn't conclude until the lows of early October, 2011. Following that the market put in Primary Waves III, IV and V into this January's top. This means that the January top is the culmination of a nine year bull market that started at the March, 2009 lows. As such the current bear market could last much longer and reach far deeper than in the 1st alternate.
Alternate #2

There is some basis for favoring the 2nd alternate in terms of the financial environment. Up until last fall the period from March, 2009 forward was notable for the multiple Federal Reserve Quantitative Easing programs. These programs supplied extraordinary financial liquidity to US markets and arguably fueled the bull. Last fall the Fed began reversing that liquidity flow in an effort to unwind it's bloated balance sheet. Thus not only is the fuel no longer being supplied, it's actually being siphoned out. So an EW count showing a completed move starting in 2009 and ending this January ties right in.
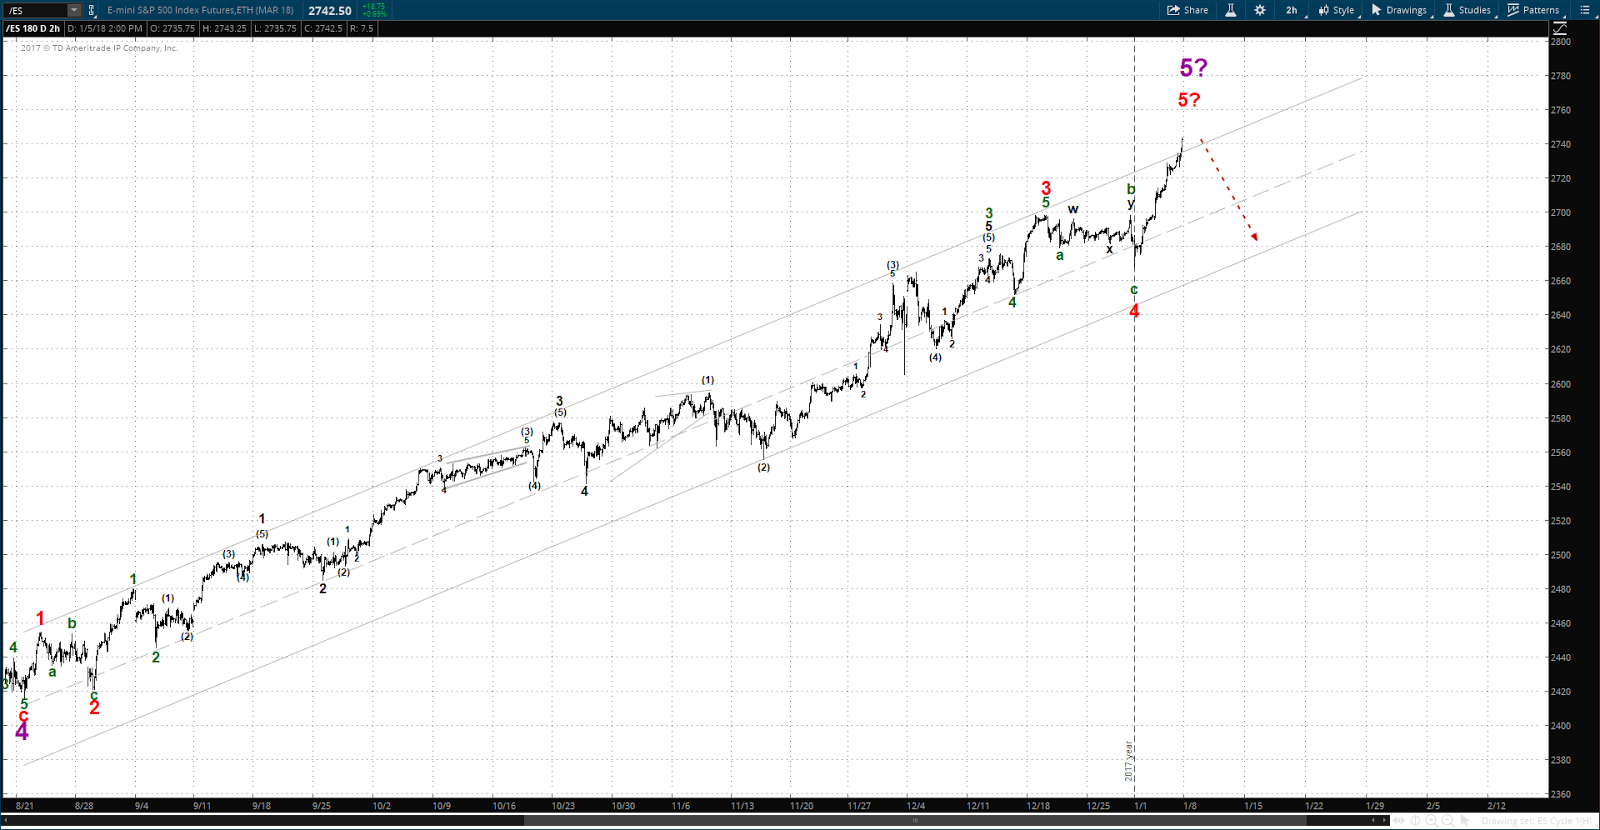
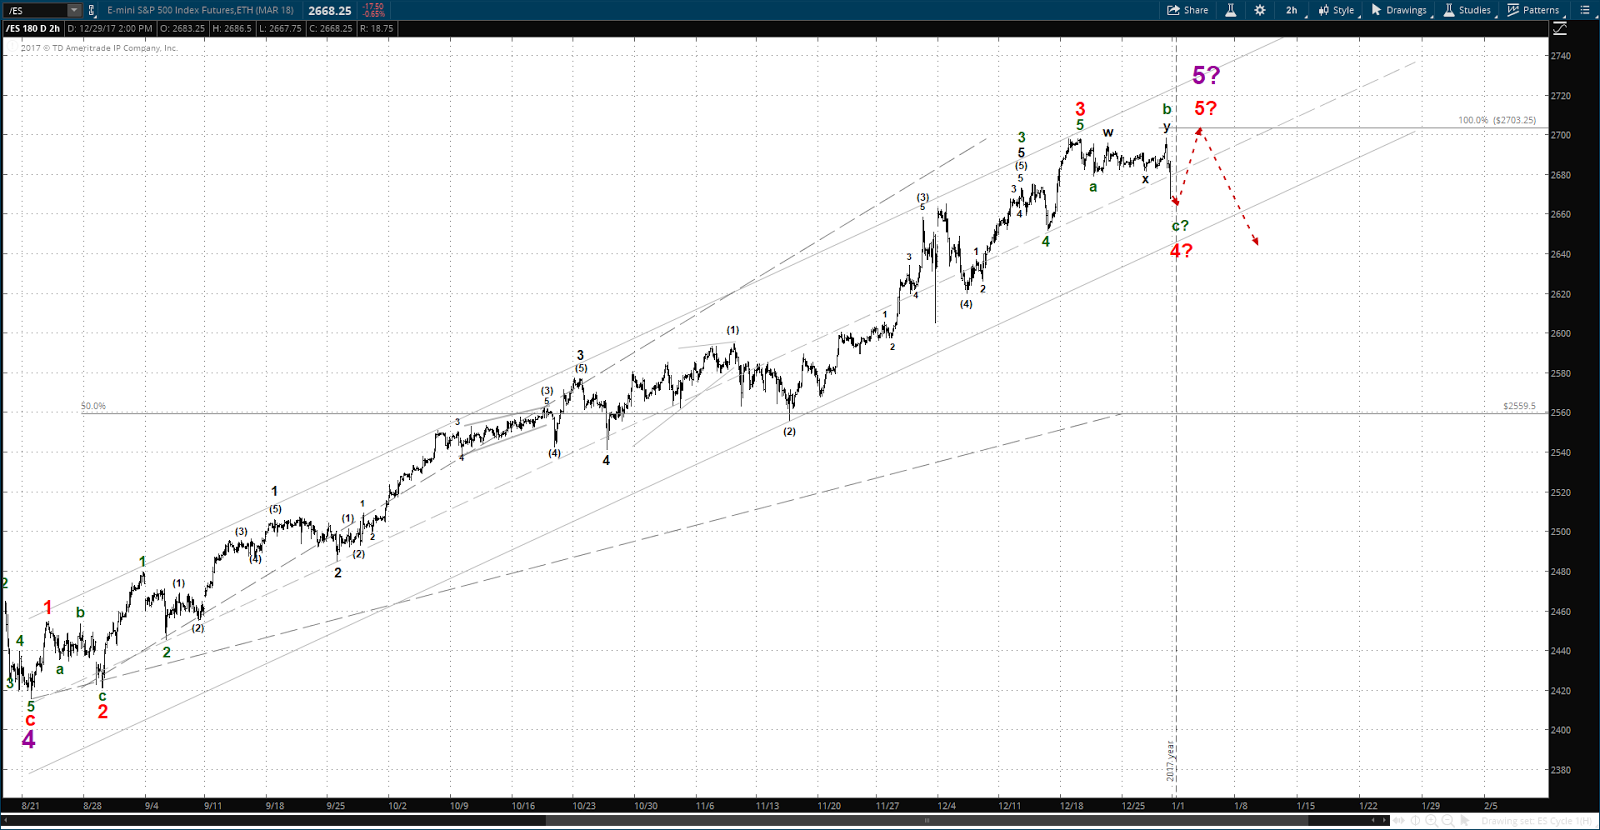
NOTE: dotted lines show potential EW structures and are not necessarily accurate price/time forecasts