CURRENT CHARTS


Click HERE to view current charts


Saturday, October 31, 2015

Saturday, 10/31/15 update

We appear to be at or close to a top of some type.
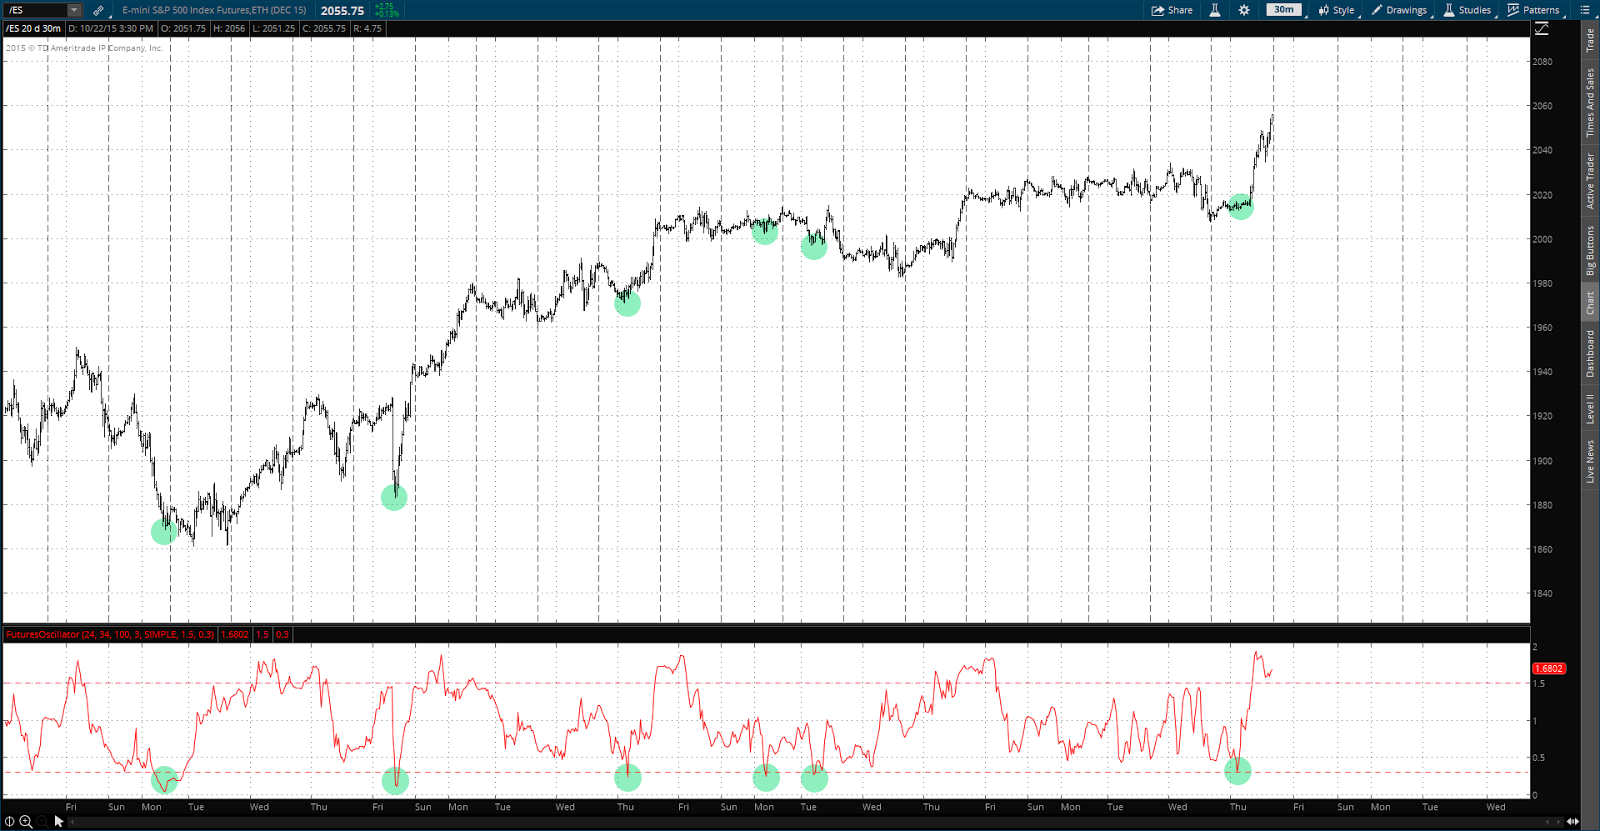
5 waves up can be counted as almost complete or complete from the Sep 29 low:


Technical underpinnings are falling away:


If the market does turn south in the near future, the big question is whether we'll see a relatively limited correction in a new bull trend or if we'll see a resumption of the summer's bear market.  What's particular ominous is that the current run up has seen a decided lack of participation by the broader market as compared to the more narrowly based DJIA and SPX.  Yes money has been flowing into equities over the last month, but it's been primarily flowing into what is considered lower risk issues.  This is a classic bear market phenomenon.  You can draw your own conclusions, but I can tell you that I closed my long ES positions on Friday.


Thursday, October 22, 2015

Thursday, 10/22/15 update

How does that saying go?  Better to remain silent and be thought a fool then to open one's mouth and remove all doubt.  That applies very well to yesterday's post - talk about being dead wrong.

With today's strong rally it has to be recognized that the bull alternate is looking much more likely.  In the ES we're 230 points up off the August crash low and (as of this writing) around 75 points away from new ATH's.  Possible EW count looks like this:


I have to admit this possibility really irritates my bearish inclinations.

--------------------------------------------------------------------------------------------------------------------------
The Futures Oscillator presented on this blog a little while ago is showing an interesting piece of behavior.  This tool is very new and I've only been using it for a couple of months.  It's lows in that short period of time have often been in the form of spikes, and more often then not they are pretty good places to go long:


Wednesday, October 21, 2015

Wednesday, 10/21/15 update

Looks like the ES may finally have topped today after a few days of torture in the form of an ending diagonal 5th wave.  The high print overnight last night was 2034.25, right smack in the resistance area identified in last weekend's post:


The question of whether the move up of the last few weeks was the C wave in a bear market rally as in the above chart or whether it was a leg of a developing bull market still remains open.  There are two areas of potential support that bear watching (no pun intended): ES 1990 and below that ES 1930.   The blue line in the hourly chart below highlights those:


Saturday, October 17, 2015

Saturday, 10/17/15 update

Since the ES 1861.00 low on Sep 29 the has rallied 165 points into Fridays high at 2026.50 in an impulse type pattern.  Last spring and summer the ES found support in the 2032-2034 area four times, so that level could well provide resistance to the current rally and be an area where prices turn back down.


The hourly chart, if the count is correct, shows waves 1 thru 4 of the impulse complete with wave 5 in progress:


Interestingly, the "Pretzel Method" generates a target for the impulse of 2036.75, which lines up nicely with support/resistance level at 2032-2034.  In the Pretzel Method, the midpoint of the 3rd wave in an impulse is identified, then the distance from the start of the impulse to that 3rd wave midpoint is added to the 3rd wave midpoint value to derive a target for the entire structure.  In this case the 3rd wave midpoint is at 1948.88.  The distance from the 1861 low to 1948.88 is 87.88 points, adding that to 1948.88 yields a target of 2036.76.  (note: I've also found that if the 1.00 X multiple fails, prices will often get stopped at the 1.618 X multiple.)

From a longer term perspective the question of whether the Primary Wave IV correction was complete at the August lows remains open.  If it was not complete, then this coming correction could be the 1st wave of some significant selling as indicated in the daily chart above.  If it was complete, then the coming correction will be just that - a correction to a developing bull trend.  That daily chart looks like this:


Saturday, October 3, 2015

Saturday, 10/3/15 update

Been staring at charts for hours.  There are at least six EW possibilities at the moment from a short and intermediate term perspective.  One that intrigues me is that we saw the bottom of wave 1 of an ending diagonal 5th wave at this week's low and wave 2 is in progress:


EDIT 10/4
-------------------
Longer term view & count on above possibility: