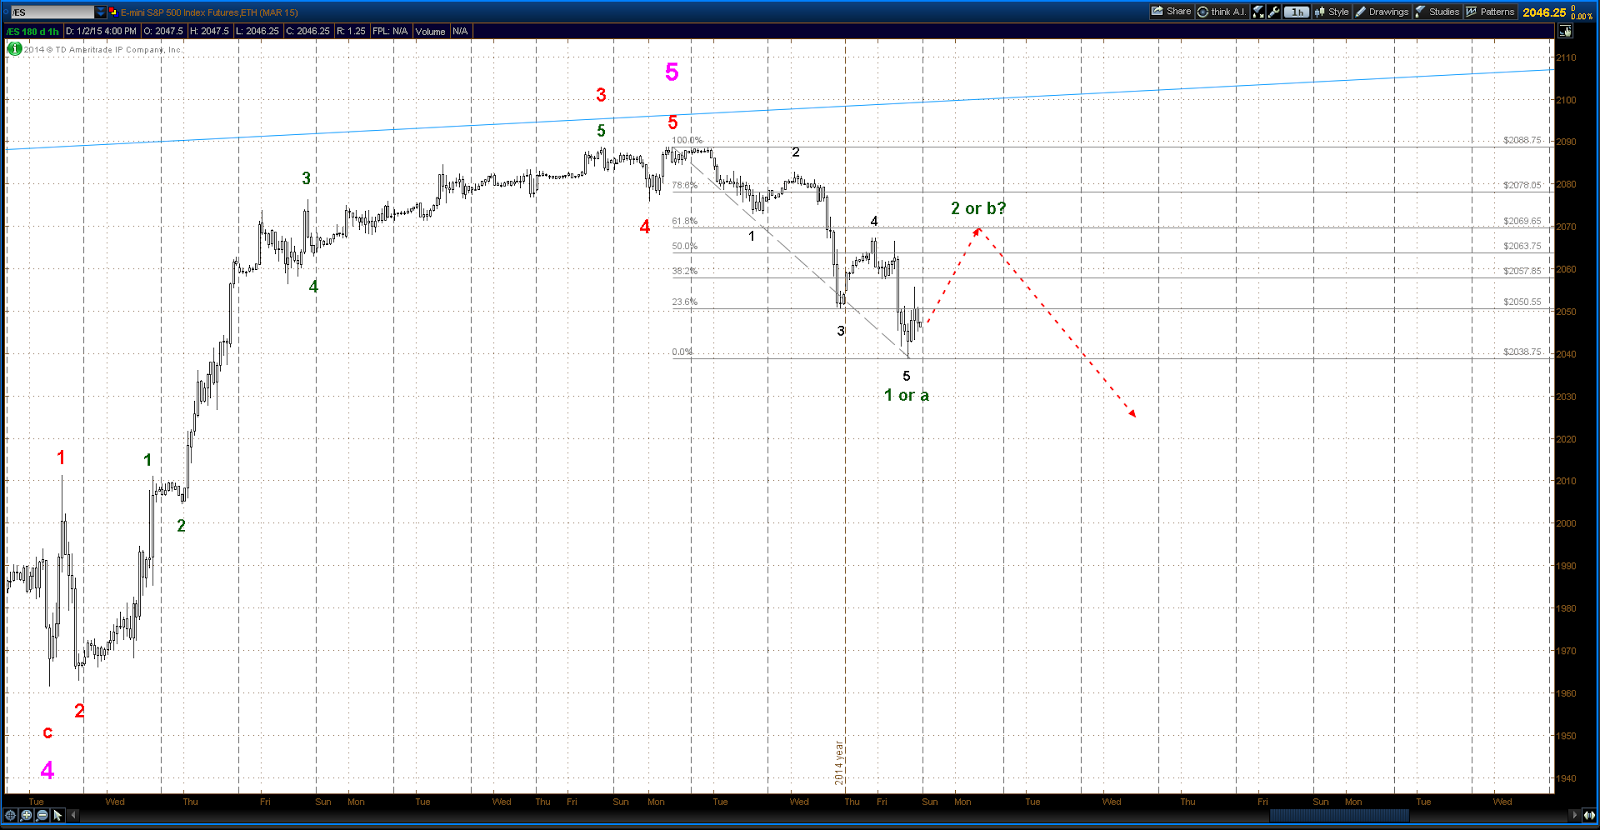
CURRENT CHARTS


Click HERE to view current charts


Saturday, January 31, 2015

Saturday, 1/31/15 update

Alternate #1

Alternate #2


The selling that occurred in the last few hours of Friday's session is ominous.  The triangle possibility presented on Thursday and in Alternate #2 above (daily charts below) is still on the table but very close to being ruled out.  Any serious follow through selling that pushes the ES below the triangle's "C" wave low @ 1970.25 does invalidate that possibility.
The triangle idea was born out of the difficulty in discerning the EW pattern in the muddy mess that the ES has laid out in the last few weeks.  The cash (SPX) is somewhat cleaner but still difficult.  Especially troublesome is the rally of the week before last.  Alternate #1 assumes this rally to be the "c" wave of a flat, in which case it needs to be a 5 wave structure.  As can be seen, I can make a 5 wave count out of the structure if I stand on my head while twiddling my thumbs and whistling Dixie.  But the fact is that it counts much better as a 3 wave move as in Alternate #2.  One thing for sure:  it's very much a corrective type move, and the market did in fact embark on a week of bear action after it's conclusion.

However, the odds of the triangle being in play have to be considered low at this point, which leaves Alternate #1.  If that's the case, then there could well be a sharp acceleration in the selling giving the set of nested waves 1 & 2 apparent in last week's price action.  So buckle your seat belts.

One final note:  There are a couple of bullish alternates that are possible here, but until the market shows that they are more probable they will stay in reserve.

Daily Charts

Alternate #1

Alternate #2

Thursday, January 29, 2015

Thursday, 1/29/15 update

The last month has been about as difficult as it gets using Elliott Wave on the ES/SPX.  Discerning what exactly is unfolding has been a real challenge.  Although the bias seems to be bearish it's not clear that the intermediate term direction is down - i.e. that a sustained bear market is underway.  With that thought in mind a possible alternate is that the market has formed a triangle in the action going back to the early December highs, with the last move in that formation complete today or very soon.  This possibility is laid out in the following charts:


If the rally that commenced today fails and the ES drops below the Intermediate Wave C low of 1970.25 then this possibility will be invalidated.

Saturday, January 24, 2015

Saturday, 1/24/15 update

More than once in the last week I've stared at a chart of the ES and asked: what ARE you doing?  The pattern since the Dec 16 low is chock full of overlaps and 3 wave moves in both directions, extremely difficult to discern from an Elliott Wave perspective.  It's been like watching a swimmer who's escaped from a strong undertow and now has his head above water, but that undertow is not far below the surface and is tugging at his feet.  So what happens if that swimmer gets tired?  Bear market time.....

Anyway, the below short term count is very tentative.  If correct, the move up from the Dec 16 lows hasn't got a lot farther to run, after which the bottom should fall out.


There are a number of bullish possibilities here, but they come into play if the ES keeps moving up to new ATH's.  If that occurs then those possibilities can be examined.

Sunday, January 18, 2015

Sunday, 1/18/15 update

Bear alternates:


Bull alternate:


Saturday, January 10, 2015

Saturday, 1/10/15 update

As usual, there is a bull and a bear alternate at this juncture.  The selling that occurred from the end of December into last Tuesday looks much more like a 5 wave impulse as in the bear alternate rather than a zig-zag as in the bull.  For that reason the bear alternate has to be given the edge.

Bear alternate

Bull alternate

Sunday, January 4, 2015

Sunday, 1/4/15 update

Will there ever again be a bear market in equities worthy of the name?  It appears that based on the prevailing sentiment the answer is "NO".  Of course this is hogwash.  The question really is when will the next significant bear market occur?  Since the 2009 bottom and especially since the 2011 low the ES/SPX has relentlessly ground higher with only minor hiccups along the way.  And it could keep grinding higher for some time yet. 
However, from an EW standpoint the very 1st condition to be met for a sustained bear to occur is now in place, and that is a clear 5 wave impulse down from a top.  Since the 2088.75 high of Dec 29 the ES chart shows a classic looking 5 wave down structure into Friday's low at 2038.75.  So for sure there should be more to come in this sell off following a corrective sequence of a day or two - in EW an initial 5 wave move in the direction opposite to the prior trend indicates the necessity for at least one more impulse in that opposite direction (unless the initial impulse was the C wave of a flat, which is not the case here).  So there should be more selling showing up by the end of next week.  If this is to turn into something more serious, there needs to be continued selling past a correction to the next selloff - i.e. a down impulse of larger degree needs to form.  So stay tuned.