CURRENT CHARTS


Click HERE to view current charts


Saturday, December 26, 2015

Saturday, 12/26/15 update

Well, we got the obligatory Santa Claus rally last week in the ES/SPX, and if the market stays true to the history of recent years that rally will extend into the end of the year next Thursday.  BUT we ended the week quite "overbought", so maybe not.

There are a number of bull & bear alternate EW counts at this juncture, some of which are fairly complex and counter-intuitive.  I could post those, but I think the comparison presented a couple of weeks ago is more significant for the intermediate term (and maybe long term as well).


To state the obvious, to resolve this either the broad market as represented by the NYA will rally strongly to match the position of the SPX (blue chips) or the SPX will decline significantly to harmonize with the NYA.  Given that the Russell 2000, the Wilshire 5000 and (importantly) the Dow Jones Transport (as pointed out by Pretzel) are also showing weakness relative to the SPX, then it's quite likely that the bear  is going to take control of the SPX in the not to distant future.

Saturday, December 19, 2015

Saturday, 12/19/15 update

Things are looking pretty grim here.  IF this count is correct, we have a series of two nested waves 1 & 2 down since the "c" wave failure of Dec7th with a 3rd of a 3rd wave underway.


Sunday, December 13, 2015

Sunday, 12/13/15 update

From last weekend's post:
"In recent years the equity markets have been doing an excellent job of training folks to always "buy the dip".  That strategy was certainly successful this last week.  One of these days a whole lot of bulls are going to get trapped by that mentality."  

I made this comment because of concerns based on the following chart:


Note that since late October the S&P 500 (top chart) has been much stronger than the broader market as represented by the NYSE Composite (bottom chart).  This is a great big flashing yellow light on the highway to bull market bliss.  Can the ES/SPX shake off last weeks bear action and go on to new all time highs?  Sure it can, but if the broader market doesn't quickly follow suit then those new ATH's are liable to mark the last gasp before a significant change in long term trend.

If the ES/SPX doesn't turn back up soon, below are a couple of bear market possibilities.  Both of these alternates assume that Primary Wave IV of the bull market off the 2009 lows is still in progress.  Primary Wave II lasted 8 months, Primary W IV commenced last May, so a couple more months for the move would be in proportion:

Bear alternate #1 - multiple zig-zag 

 Bear alternate #2 - triangle

One final thought.  Imagine you are a portfolio manager or financial adviser.  It's Friday, Dec 11.  There are only 3 weeks left until the end of the year when results for the year are locked in and subsequently reported to and evaluated by clients and potential clients.  You have a very short time remaining to spiff things up, only 13 more trading days, and two of those days are holiday eves when there isn't a whole lot of market participation.  Meanwhile, interest rates are going up, commodities are crashing and the wheels are coming off the equity markets.  What are you going to do on Monday? 

Sunday, December 6, 2015

Sunday, 12/6/15 update

In recent years the equity markets have been doing an excellent job of training folks to always "buy the dip".  That strategy was certainly successful this last week.  One of these days a whole lot of bulls are going to get trapped by that mentality.  But it appears we're destined for new all time highs before that occurs.

Current most likely count in the ES:

Short term 

Intermediate term

Long term

Saturday, November 21, 2015

Saturday, 11/21/15 update

Best guess on the EW count for the ES:

Intermediate term:


Short term:


Sunday, November 15, 2015

Sunday, 11/15/15 update

Market ended the day pretty "oversold" on Friday, but IF the below short term count is correct it still has a bit to run before a short term bottom:


The bigger question still remains, and that is whether this is just a correction in a new bull trend from the August lows as in the 1st chart below, or if it is a resumption of last summer's bear market as in the 2nd chart:


Saturday, November 7, 2015

Saturday, 11/7/15 update

Best guess on the count for the rally from the Sep 29 low:


There are a number of ways to count this rally, so this is only the most likely possibility.  Note that the pattern of Wed-Thur-Fri this last week looks like a triple zig-zag but could also count as a leading diagonal - i.e. it could be the 1st wave of a deeper correction.  In that case, the Minute W1 top of last Wed is actually the Minor W5 top of the entire rally from Sep 29. 
If the market resumes the rally next week, then this count becomes invalidated at ES 2167 where Minor W5 would exceed the length of Minor W3 - since Minor W1 in this count is longer than Minor W3, then Minor W5 must be shorter than Minor W3 to adhere to EW rules.

Saturday, October 31, 2015

Saturday, 10/31/15 update

We appear to be at or close to a top of some type.
5 waves up can be counted as almost complete or complete from the Sep 29 low:


Technical underpinnings are falling away:


If the market does turn south in the near future, the big question is whether we'll see a relatively limited correction in a new bull trend or if we'll see a resumption of the summer's bear market.  What's particular ominous is that the current run up has seen a decided lack of participation by the broader market as compared to the more narrowly based DJIA and SPX.  Yes money has been flowing into equities over the last month, but it's been primarily flowing into what is considered lower risk issues.  This is a classic bear market phenomenon.  You can draw your own conclusions, but I can tell you that I closed my long ES positions on Friday.


Thursday, October 22, 2015

Thursday, 10/22/15 update

How does that saying go?  Better to remain silent and be thought a fool then to open one's mouth and remove all doubt.  That applies very well to yesterday's post - talk about being dead wrong.

With today's strong rally it has to be recognized that the bull alternate is looking much more likely.  In the ES we're 230 points up off the August crash low and (as of this writing) around 75 points away from new ATH's.  Possible EW count looks like this:


I have to admit this possibility really irritates my bearish inclinations.

--------------------------------------------------------------------------------------------------------------------------
The Futures Oscillator presented on this blog a little while ago is showing an interesting piece of behavior.  This tool is very new and I've only been using it for a couple of months.  It's lows in that short period of time have often been in the form of spikes, and more often then not they are pretty good places to go long:


Wednesday, October 21, 2015

Wednesday, 10/21/15 update

Looks like the ES may finally have topped today after a few days of torture in the form of an ending diagonal 5th wave.  The high print overnight last night was 2034.25, right smack in the resistance area identified in last weekend's post:


The question of whether the move up of the last few weeks was the C wave in a bear market rally as in the above chart or whether it was a leg of a developing bull market still remains open.  There are two areas of potential support that bear watching (no pun intended): ES 1990 and below that ES 1930.   The blue line in the hourly chart below highlights those:


Saturday, October 17, 2015

Saturday, 10/17/15 update

Since the ES 1861.00 low on Sep 29 the has rallied 165 points into Fridays high at 2026.50 in an impulse type pattern.  Last spring and summer the ES found support in the 2032-2034 area four times, so that level could well provide resistance to the current rally and be an area where prices turn back down.


The hourly chart, if the count is correct, shows waves 1 thru 4 of the impulse complete with wave 5 in progress:


Interestingly, the "Pretzel Method" generates a target for the impulse of 2036.75, which lines up nicely with support/resistance level at 2032-2034.  In the Pretzel Method, the midpoint of the 3rd wave in an impulse is identified, then the distance from the start of the impulse to that 3rd wave midpoint is added to the 3rd wave midpoint value to derive a target for the entire structure.  In this case the 3rd wave midpoint is at 1948.88.  The distance from the 1861 low to 1948.88 is 87.88 points, adding that to 1948.88 yields a target of 2036.76.  (note: I've also found that if the 1.00 X multiple fails, prices will often get stopped at the 1.618 X multiple.)

From a longer term perspective the question of whether the Primary Wave IV correction was complete at the August lows remains open.  If it was not complete, then this coming correction could be the 1st wave of some significant selling as indicated in the daily chart above.  If it was complete, then the coming correction will be just that - a correction to a developing bull trend.  That daily chart looks like this:


Saturday, October 3, 2015

Saturday, 10/3/15 update

Been staring at charts for hours.  There are at least six EW possibilities at the moment from a short and intermediate term perspective.  One that intrigues me is that we saw the bottom of wave 1 of an ending diagonal 5th wave at this week's low and wave 2 is in progress:


EDIT 10/4
-------------------
Longer term view & count on above possibility:


Sunday, September 27, 2015

Sunday, 9/27/15 update

In the ES on the short term, the pattern since the spike high on 9/17 @ 2011.75 into last Thursday's low at 1897.25 is an impulse:


The count may look a bit awkward, but it is supported by the patterns in the SPX and the NYA over the same time frame which are clearly 5 wave moves.  As noted on the chart the bounce since Thursday's low may be all of the correction against that impulse or wave "a" of that correction.  If the correction has more to come then a possible area for it's conclusion is the .618 retrace of the impulse at ES 1968.  That level also happens to be the area where the 4th wave of the down impulse topped, which is a common retrace terminus for a correction.


Backing out to a longer view, it's very difficult to see how the action in the market since the ES 1831.00 crash low of Aug 24 into the Sep 17 spike high is anything but a corrective sequence.  Lots of overlaps and choppiness, anything but an impulsive character which would mark the start of a bull move.  So it is most probable that the 1831.00 low will be tested and likely exceeded in the coming weeks.

Monday, September 21, 2015

Monday, 9/21/15 update

Here's another short term possibility that I didn't see until this morning:


Sunday, September 20, 2015

Sunday, 9/20/15 update

Let's start with the short term.  The sell off that started Thursday has generated a 5 wave structure with the 5th wave close to completed (or complete):


The Equity Oscillator and Tick Analysis are down at the bottom of their ranges, so the technicals are in a position where a rally is made possible:


So the set up for a short term rally is in place.  If the impulse off the Thursday high is not complete, ES 1939.50 and 1934.00 are levels to watch for a turn.  One final note: in the above count wave 3 is shorter than wave 1, so wave 5 cannot exceed wave 3.  Based on that observation, ES 1928.75 is the point at which waves 5 and 3 would be equal, so a continuation below that level will mean that something else is at play here - either the move is extending or it's forming something other than an impulse.

Backing out to a longer perspective, the ES has formed a double zig-zag from the Aug 24 crash low at 1831.00 into Thursday's spike high at 2011.75:


Elliott Wave rules allow for up to three zig-zags in a multiple zig-zag formation.  So there is the possibility that the structure off the 1831.00 low is not complete.  At this point that likelihood appears to have a low probability but it has to be recognized.  The probability is low because as of Thursday the upward drift since the 1831.00 low has provided relief to the "oversold" conditions extant at that low.  So the favored view is that the ES has concluded a bear market correction as of Thursday and more significant selling is on deck following a short term rally early next week.

Saturday, September 12, 2015

Saturday, 9/12/15 update


Not a lot has changed since the update of last Saturday.  The market continued to move sideways during the week with a push up to the ES 1990 area where it was rejected a couple of weeks ago and where it was rejected once again on Wednesday.  Thursday and Friday were a sideways drift that has the look of a base for another bullish push.
The EW count in the above chart is only one of a number of possibilities.  It is not necessarily the most likely except in the sense that it portrays a market relieving a severely "oversold" situation but not a market in the initial stages of an extended bull move - i.e. the market is taking a breather before continuing the bear trend that commenced last Spring.

There is proof that there is more to come from the bear.  The Equity Oscillator - Daily (see the post of last Monday) is a tool developed in the mid '80's and tracked by the author since that time.  The original version of the EOD has a periodicity of 7-10-10 days and generates peaks and troughs relatively quickly on a daily basis.  When the 7-10-10 EOD registers a significant low it typically shoots up off that low as the maxed out legs of the indicator quickly move into positive territory.  If the market has truly seen a significant price low then the upwards acceleration of the 7-10-10 EOD is accompanied by a sustained and rapid appreciation in price.  So in those situations the EOD is signalling the kick-off to a new bull market.  However, there are times when the thrust up by the EOD is not accompanied by an equivalent thrust in prices.  Almost without fail those instances are a sign of a bear market rally that eventually rolls over.

To illustrate, take a look at the 7-10-10 EOD charted against the NYA in 2009 (sorry, this chart is out of Excel, my trading platform does not have all the necessary stats to construct the EOD earlier than 2013):

On the left side of the chart note how the EOD (blue line at bottom of chart) shoots up off an oversold level near a reading of .50 in early March, 2009 and quickly peaks above 2.50 a week or so later. Meanwhile prices also shoot up off that low but continue to run higher in the following months with very little hesitation.

Now look at the same data for recent months:
Once again both the 7-10-10 EOD and prices shoot up together off a significant low, but now we see prices failing to sustain their upward momentum.  That in turn appears to have capped the EOD.  This is very much the picture of a bear market rally.  So this analysis is signalling more bear market to come.

Monday, September 7, 2015

Monday, 9/7/15 The Equity Oscillator - Daily

First a note on the name: the oscillator was called "Al's Indicator" which, let's face it, is kind of ......... klunky.  Since it is an oscillator based on NYSE composite daily statistics, the name Equity Oscillator - Daily seems more apt.
The Equity Oscillator - Daily (EOD) is a compilation of daily NYSE Adv/Dec, volume and momentum statistics developed by the author in the mid-1980's before the advantage of today's PC based trading platforms.  For years it was maintained by manual entry into digital spreadsheets - originally Lotus 1-2-3 and eventually Excel.  With modern digital trading platforms it is possible to generate this oscillator real time and also to back test variations of the input time frames.  The author has been doing just that in recent months.  The original oscillator had a periodicity of 7, 10 and 10 days for the three oscillator components.  The back test process revealed that oscillator values of 13, 19 and 19 days generated a more effective oscillator.
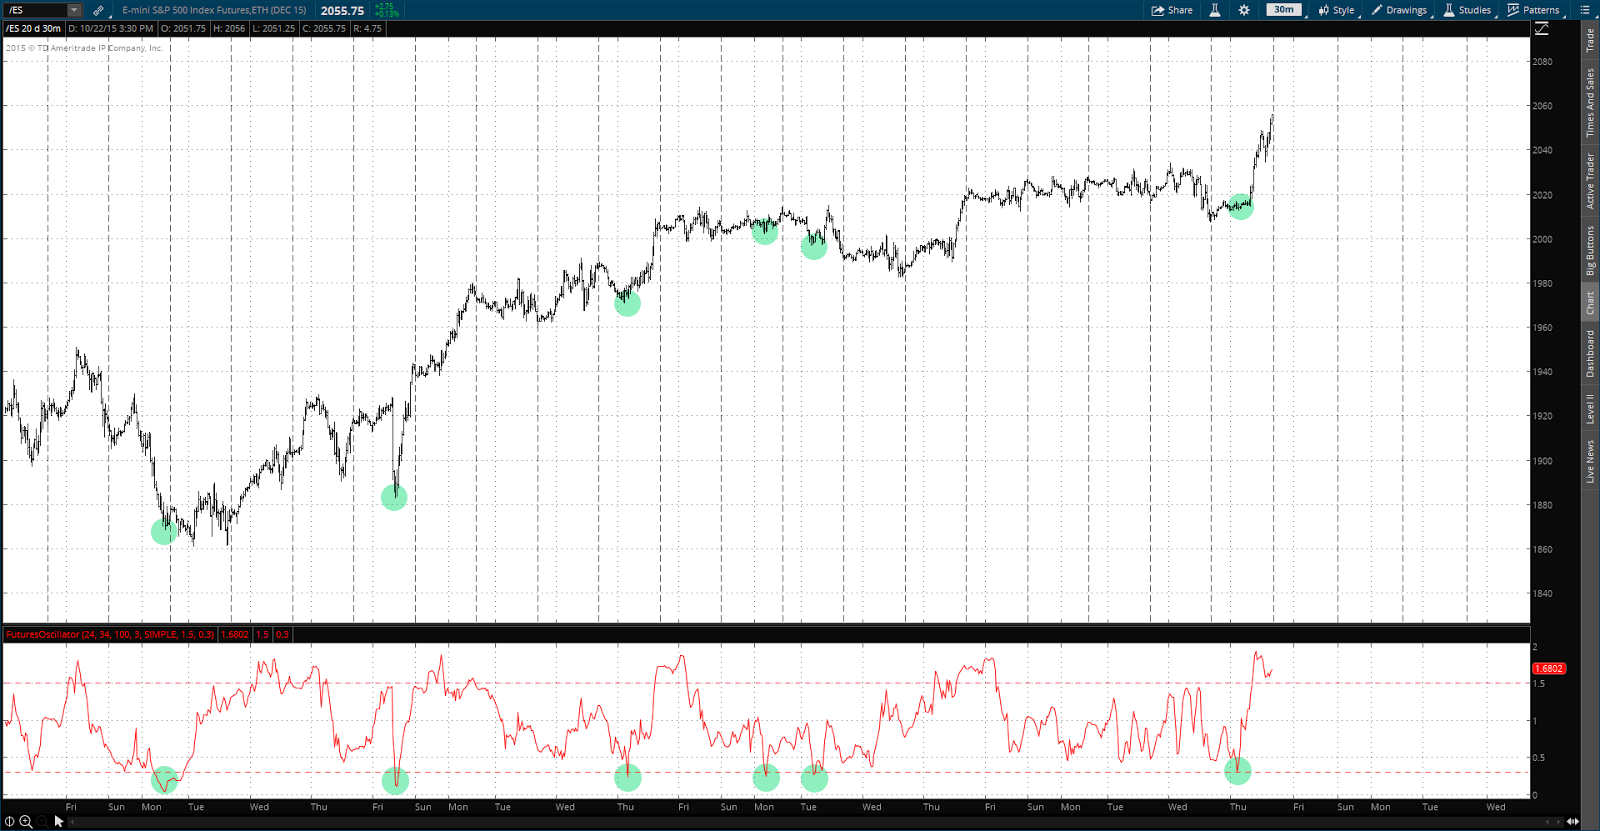
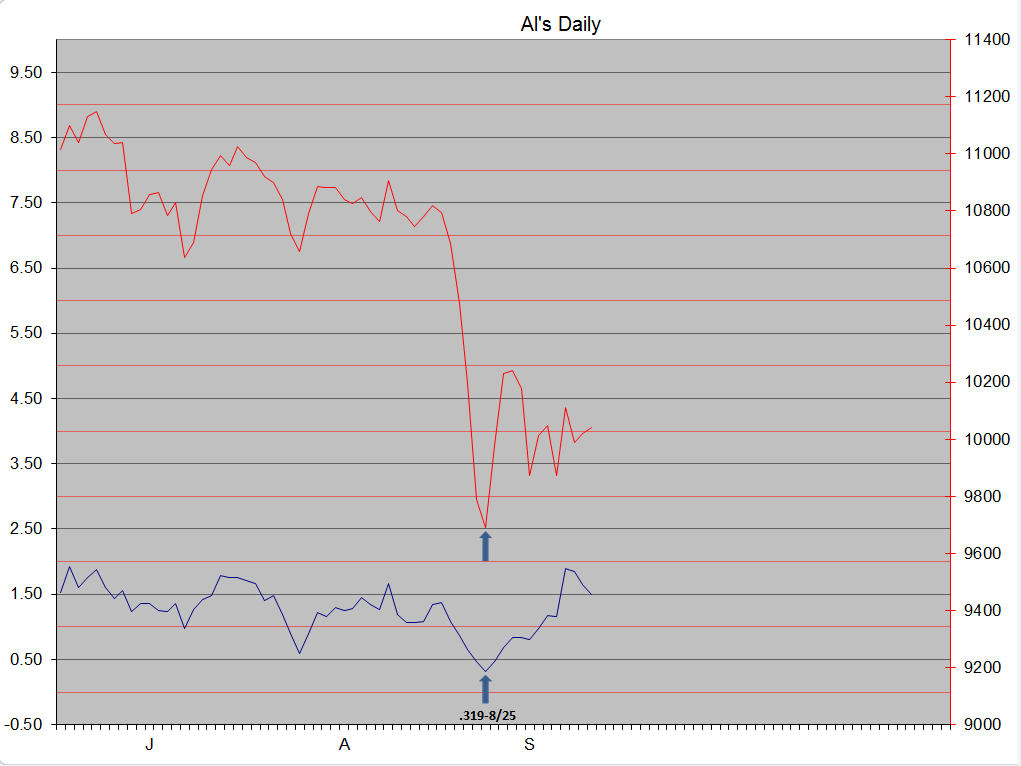
The EOD may be considered overbought at a reading higher than 2.00 and oversold below 1.00.  It is combined with a trendline analysis to provide entry and exit signals for NYSE and NYSE derived indexes and vehicles.  The trendline is usually derived by first drawing a regression line based on the daily closes for the trend in progress.  Then a parallel line to the regression line is drawn and placed above or below the daily bars (depending on the direction of the trend) such that it touches the lowest daily low or highest daily high in the sequence in a manner that doesn't dissect another daily low or high.  A picture is worth a thousand words, so here is a chart of some recent trends to illustrate the application:


Trade entries/exits are made when the EOD is at or very near overbought or oversold levels after cycling up or down from the preceding oversold or overbought level and the daily close has penetrated below or above the trendline defining the trend that has been in progress.  This is assumed to signal a change in trend.
Any trading approach needs a stop loss component.  The method employed here uses Wilder's ATR.  The ATR for the instrument traded is multiplied by 2 and added or subtracted from the entry price to establish the stop loss point.  It is the author's opinion that stop losses are disaster protection only and that setting SL's too close runs the risk of market noise preventing the trade from achieving what will ultimately be a winning position.  Also, setting a SL quantifies the trade's risk for purposes of money management.
Finally, as in any system, there are times when a trade becomes a loser.  Also, there are times when the oscillator stops oscillating.  In both these situations, what has occurred is that the time periods used in the 13-19-19 EOD are not properly defining the cycles at work.  The solution is to drop to the 7-10-10 EOD for trading signals, and once a successful trade has been generated then revert to the 13-19-19 EOD.

Below are the backtesting results for the EOD trading system.  The ES (S&P E-mini futures) was used as the trading vehicle, but any NYSE derived vehicle should work.  Because some of these trades span multiple months, if the ES were used there would need to be expiration month rollovers.  To keep things simple this was not provided for in the simulation.  If the ES were used as a trading vehicle it would probably make things easier if the out month contract were used instead of the nearest expiration.  For example, if making a trade in the month of August use the December expiration rather than September.

2013

2/21/13 Sell @ 1502.00     3/4 Buy @ 1527.50  --  25.50 loss
3/4 Buy @ 1527.50     5/23 Sell @ 1650.75 --  123.25 gain
5/23 Sell @ 1650.75     7/5  Buy @ 1629.25 --  21.50 gain
7/5 Buy @ 1629.25     7/29 Sell @ 1682.50 --  53.25 gain
7/29 Sell @ 1682.50     9/4 Buy @ 1655.00 --  27.50 gain
9/4 Buy @ 1655.00     9/20 Sell @ 1703.75 --  48.75 gain
9/20 Sell @ 1703.75     10/10 Buy @ 1683.00 --  20.75 gain
10/10 Buy @ 1683.00     11/5 Sell @ 1757.00  -- 74.00 gain
11/5 Sell @ 1757.00     11/15 Stopped @ 1790.00  --  33.00 loss
11/20 Sell @ 1779.75     12/18 Buy @ 1804.00 --  24.25 loss

2014

12/18/13 Buy @ 1804.00     1/2/14 Sell @ 1826.50 --  22.50 gain
1/2 Sell @ 1826.50     2/6 Buy @ 1768.50 --  58.00 gain
2/6 Buy @ 1768.50     3/11 Sell @ 1864.75 --  96.25 gain
3/11 Sell @ 1864.75     4/16 Buy @ 1852.75 --  12.00 gain
4/16 Buy @ 1852.75     7/17 Sell @ 1948.75 --  96.00 gain
7/17 Sell @ 1948.75     8/8 Buy @ 1923.25 --  25.50 gain
8/8 Buy @ 1923.25     9/8 Sell @ 2000.75 --  77.50 gain
9/8 Sell @ 2000.75     10/21 Buy @ 1938.75 -- 62.00 gain
10/21 Buy @ 1938.75     12/8 Sell @ 2060.50 --  121.75 gain
12/8 Sell @ 2060.50     12/18 Buy @ 2061.25 --  0.75 loss

2015 


12/18/14 Buy @ 2061.25     1/6/15 Stopped @ 2004.25 --  57.00 loss
1/20 Buy @ 2016.25     3/4 Sell @ 2096.25 --  80.00 gain
3/4 Sell @ 2096.25     3/16 Buy @ 2067.00 --  29.25 gain
3/16 Buy @ 2067.00     5/29 Sell @ 2106.00 --  39.00 gain
5/29 Sell @ 2106.00

Saturday, September 5, 2015

Saturday, 9/5/15 update


Probably the most difficult aspect of Elliott Wave is the fact that at any given market juncture there are usually multiple possible alternates.  Right now that is the case.  The preferred count on this site is that of a double zig-zag into the ES 1831 low of Aug 24.  That low could have marked the bottom for Primary Wave IV.  However, EW allows for up to three zig-zags in a multiple zig-zag sequence, so there is the possibility of further bear market.  So was that it at 1831?  The pattern since that low suggests that it wasn't.


An adage in market analysis is that markets develop tops and make bottoms - i.e tops tend to be rounded formations and bottoms tend to be V's.  That's definitely been the case in the ES/SPX since the 2009 bear market bottom.  The final lows in corrections during that time have tended to kick off sharp and sustained rallies for a couple of weeks or so.  That's not what we're seeing since the Aug 24 low.  So the preference has to be given to that of an "X" wave in progress (or a 4th wave, see below).  In fact, it's possible that an "X" wave was complete at the Aug 27 high labeled as an Intermediate Wave "A" in the above chart.  If that's the case, we should continue downward from here.  It should be noted that the proposed "X" wave can take a number of forms and the projected labeling shown is only one of those possibilities.

Another alternate to be considered is that the entire drop from the mid-May all time highs is a developing "A" wave impulse of a simple zig-zag:


In this alternate the sequence since the Aug 24 low is a Minor W4.  As can be seen, this alternate portends quite a bit of volatility yet to unfold.  As usual, the dotted lines in the chart are there to represent the structure needed to complete the pattern and ARE NOT price and time projections.

Saturday, August 29, 2015

Saturday, 8/29/15 update


So, was that it?  Is the correction that's been building all year done after just a few days of serious selling?  Seems like it's too quick, unless you consider the sideways track that we've seen all year to be part of that corrective process.  In that context it wasn't all that quick.

From an EW standpoint the E-mini has formed a double zig-zag into Monday's crash low at 1831.  This is labeled as Primary Wave IV in the top chart and alternates nicely with the irregular flat of Primary W II (in 2011).  EW rules allow for as many as three zig-zags separated by "x" waves in a multiple zig-zag correction.  Since the E-mini has formed two zig-zags there is room for one more "x" wave/zig-zag  sequence.  Unfortunately, using EW rules, there is no good way to determine whether that final zig-zag will occur or if Primary W IV concluded at Monday's low.  The invalidation level for further Wave IV action is all the way up at the late July "x" wave top of 2126.25.  However, it can be noted that the recent bear action was quite severe and generated "oversold" readings rarely seen. So from that standpoint Primary W IV reached it's pinnacle (not sure that's the best way to phrase it - oh well).  I'm sure the perma bulls can muster many good reasons why the correction is done, and likewise the perma bears can muster many equally good reasons why there's got to be more selling in the near future.  I'm don't believe either side can be given more credence than the other at this juncture, i.e. it's a 50/50 proposition IMHO.


The short term chart and EW count since the Monday low is equally ambiguous - so far there have been two impulse structures up since that low separated by flat style correction.  As noted in the chart, the pattern can be labeled as an a-b-c(in progress) of a corrective sequence or as a wave 1 - 2 - 3(in progress) of a developing longer term impulse.  One thing to note: on the very short term the  market reached some "overbought" markers on Friday and is due for a pullback early next week.  The dimensions of that pullback could give clues as to the nature of the rally off of Monday's bear market lows.


Sunday, August 23, 2015

Sunday, 8/23/15 update

From last weeks update:

"It is possible that the series since the July 20th high is a sequence of nested waves 1and 2, but that interpretation is beginning to strain credulity.  If that is in fact the case, then this market should break south hard and fast very soon."

As we all know, the market did break south hard and fast this last week.   So the possibility I considered least likely is in fact what we have (sort of, more on that later).

Last weeks plunge broke solidly below the interminable trading range we've seen this year, and also it broke under the channel that has defined the bull market from the Oct 2011 low.  So it is being labeled as Primary Wave IV of the bull market off the Mar 2009 lows:


Primary W IV appears to be forming a multiple zig-zag.  This alternates nicely with the irregular flat that defined Primary W II.


Best guess on the internal count on these zig-zags looks like this:


The whole sideways slop from the "a" wave low on Jul 27 into the Aug 17 interim top is very difficult to fit into the EW paradigm.  It could be a series of nested waves 1 and 2 as mentioned in last weeks update, but there are a couple of reasons why that interpretation is not a good fit, at least not for the ES.  After long study, the best labeling is that of a convoluted "b" wave as in the above chart.  From there however there is a very clear impulse in progress.   So far the current "c" wave appears to have waves 1 and 2 in place with wave 3 in progress with that 3rd wave possibly done or close to done.  However, as severe as this sell off has been there could be an extended 3rd wave.  As Yogi Berra said, it ain't over until it's over.  Identifying targets for this "c" wave is highly problematic, so the best would be to let the market tell us when it's done selling off.