I still believe that a significant long term top is being built in the ES/SPX. Top building can be a long, drawn out and torturous affair with neither much upside progress (at least as compared to what has gone before) nor any real break in prices. The trick is to catch that real breakdown when it occurs but not beforehand - if too early the market will grind you up in short order.
Current EW alternate counts can be found here (daily bars) and here (hourly bars).
Sunday, May 25, 2014
Sunday, May 18, 2014
Sunday, 5/18/14 update
"Sell in May and go away" as the adage goes, and actually there is some statistical basis for that saying as can be seen in the below chart. What's really interesting in this analysis is that over 5 years August and October are strongly negative, but on a ten year scale it's just August. Intuitively one would expect October to be consistently negative, but that's not so - at least in the most recent 10 years. Also worth pointing out is that the four month return for the May through August period on both the 5 year and 10 year span is negative (-0.61 on 5 yr, -0.60 on 10 yr), even with a solid rebound in the July period. Finally, it's great that December appears to be consistently bullish - Santa Claus is real after all!!
 And apparently true to form a significant top appears to be in place on the ES/SPX. If not, it's likely quite near.


Alternate #1 - top in place
Alternate #2 - top nearby
Sunday, May 11, 2014
Sunday, 5/11/14 update
Market grinding it out - not much to add to last weekend's update.
Updated alternates:


Updated alternates:
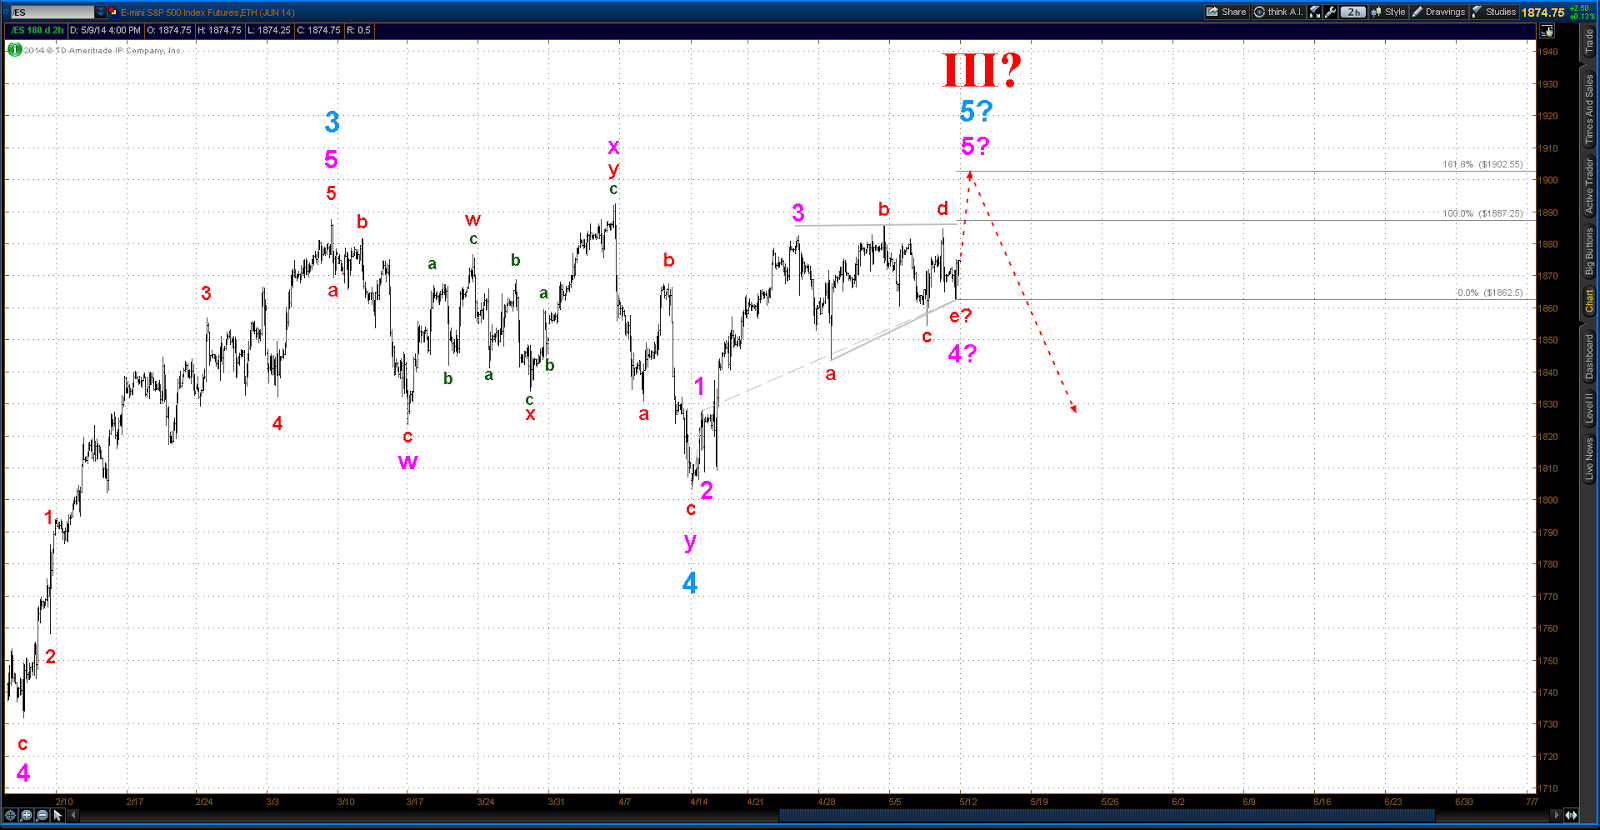
Alternate #1
Alternate #2
Saturday, May 3, 2014
Saturday, 5/3/14 update
The recent action in the ES/SPX was characterized as tentative in last weekend's update, and that adjective still applies. The chart pattern sure looks like a top of some sort is being formed. In addition to the chart pattern there are a number of other factors which are threatening to the bulls.
The first is the fact that the RUT is seriously under performing the SPX. The RUT is in black and the SPX in red in the below chart (the indicator on the bottom is a simple ratio of RUT/SPX).
 What this is saying is that the broader market as represented by the RUT is much weaker than the blue chips as represented by the SPX. This is a classic topping pattern in equities. It signals that the appetite for equity investments is waning.
Secondly there are indications that commercial players have swung to a net bearish sentiment as measured by Alex Roslin in his very excellent analysis of the weekly Commitment of Traders report: http://cotstimer.blogspot.com/.
Finally, the Fed continues to decelerate the POMO machine. Air is being let out of the balloon - kind of hard for it to continue levitating when that happens.
It's probably true that these factors are interrelated to some extent, but the fact is that the bull case remains threatened nevertheless.
The current alternates have been modified somewhat since last week. One alternate (#2 below) has the ES laying down a failed 5th wave which terminated at yesterday's high, a not unusual event given the position of that 5th wave as the last rally in an almost 3 year bull market run. Details of these alternates can be found here http://wttchartses.blogspot.com/2011/04/es-daily-chart-preferred-ew-count.html and here http://wttchartses.blogspot.com/2013/09/es-hourly-chart-preferred-ew-count-92013.html.


The first is the fact that the RUT is seriously under performing the SPX. The RUT is in black and the SPX in red in the below chart (the indicator on the bottom is a simple ratio of RUT/SPX).
Secondly there are indications that commercial players have swung to a net bearish sentiment as measured by Alex Roslin in his very excellent analysis of the weekly Commitment of Traders report: http://cotstimer.blogspot.com/.
Finally, the Fed continues to decelerate the POMO machine. Air is being let out of the balloon - kind of hard for it to continue levitating when that happens.
It's probably true that these factors are interrelated to some extent, but the fact is that the bull case remains threatened nevertheless.
The current alternates have been modified somewhat since last week. One alternate (#2 below) has the ES laying down a failed 5th wave which terminated at yesterday's high, a not unusual event given the position of that 5th wave as the last rally in an almost 3 year bull market run. Details of these alternates can be found here http://wttchartses.blogspot.com/2011/04/es-daily-chart-preferred-ew-count.html and here http://wttchartses.blogspot.com/2013/09/es-hourly-chart-preferred-ew-count-92013.html.
Alternate #1
Alternate #2
Subscribe to:
Posts (Atom)
