The continued ramp up this last week in equities has all but eliminated Alternate #2 from last weekend's post (that will be definitely eliminated with a print above the all time highs of late December @ 1846.50 in the ES). Which leaves the following as the preferred count:
This count has Major Waves 1 thru 4 complete in the bull market dating from the Oct, 2011 lows at ES 1068.00. An impressive run at this point, 70%+ gain in just over 2 years. But this count now has the ES/SPX in Major W5, which puts it in the last stages before a significant long term top. Major Wave 1 in Oct 2011 only lasted 17 trading days, so to maintain symmetry one would expect a duration of roughly the same for Major W5. From the Feb 5 low for Major W4 we've had 8 trading sessions, so by this standard a Major W5 top could occur before the end of the month.
From a shorter term perspective 4 waves up can be counted as complete from the Major W4 low on Feb 5. However, this move could very well extend, in which case this count would have to be revised with portions of it labeled at degrees a notch lower. It ain't over until it's over, as Yogi Berra said.
Assuming the above count is correct, two target area possibilities
are apparent. The first is at 1842.75 - 1843.00: Major W5 = .50 x
Major W1 @ 1842.75 and Intermediate W5 = .50 x Intermediate W1 @
1843.00. This would represent a 5th wave failure as Major W3 topped at
1846.50, so it has to be regarded as lower in probability than the 2nd
target area, especially given the strength of the rally so far. The
second target area is at 1868.75 - 1870.00: Major W5 = .618 x Major W1 @
1868.75 and Intermediate W5 = Intermediate W1 @ 1870.00.
----------------------------------------------------------------------------------------------------------------------------
I have to confess that I got a bit of a case of bear fever a couple of weeks ago. As a result I noted and then discounted the buy signal off my very own market indicator.
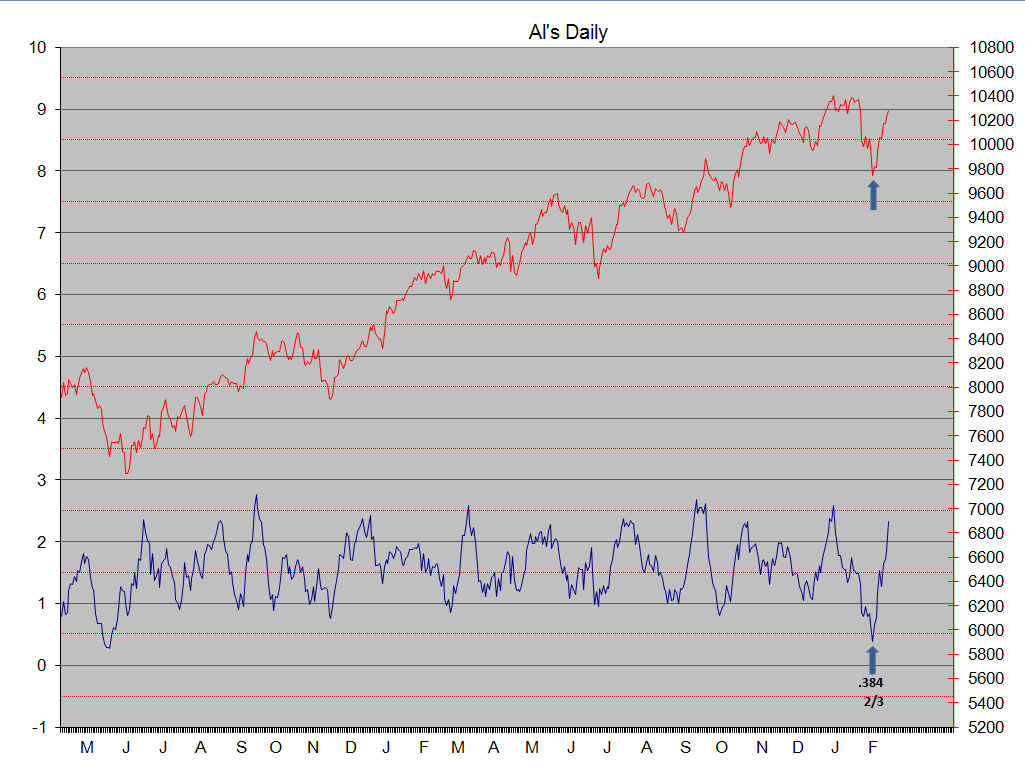
Al's Daily Indicator isn't very good at identifying tops, but is extremely good at pinpointing bottoms, especially at readings below .500. The Indicator dropped to a low of .384 on Feb 3, and then moved straight north from there - as did prices two days later. I missed a beautiful long entry on Feb 5 when the ES made a double bottom. Drat. I guess I need another injection of ice water in my veins.
The page on this blog that contains "Al's Daily" also has another study based on volume. It's a pretty simple formula. It represents the sum of the volumes on up days divided by the sum of all volume over a thirty day period. It can be used as a read on overbought/oversold status on the intermediate term. It also can be useful in other ways. Below is a chart of "Al's Daily" and the 30 day volume indicator against the daily NYSE out of TOS. (An aside: I have this data in an excel spreadsheet dating back almost 20 years, that data is manually transcribed from the Wall Street Journal and is the NYSE
Composite data, the formula in TOS uses the base NYSE statistics, so they are close to the same but not exact duplicates.)
What I want to point out is the contrast between the recent bottom pinpointed by Al's Daily as opposed to the bottom of June, 2012 or even that of late 2011. In both those earlier cases the volume study also achieved oversold levels, and the result was a powerful and long running bull market. In other words they marked the kickoff of a significant bull run. However, the recent Al's Daily low was
not matched by an oversold reading on the volume study. Message: this is not the kickoff to a major new leg in the bull market - i.e. it marks the onset of a 5th wave rather than a 1st wave.
One final word on this subject: if anyone's interested I can forward the TOS routines for both these studies, just let me know.
--------------------------------------------------------------------------------------------------------------------------
I ran across this table recently when researching something:
These are very striking numbers for a couple of reasons. First, the U.S. absolutely dominates the world economy despite all the negative economic press of recent years. That's good. But on the frightening side of the ledger, the U.S. has accrued Social Security, Medicare and other pension liabilities in the order of $80 to $100
trillion depending on your source. That's greater than current Gross World Product in
total. But that does not encapsulate the entire problem. Europe and Japan have the same picture, but to a larger degree because their populations have an ever increasing proportion of senior citizens than the U.S. So answer me a question: how is this situation going to be resolved without eventual major economic distress?