CURRENT CHARTS


Click HERE to view current charts


Saturday, December 29, 2012

Saturday, 12/29/12 update

The equity market has given it's opinion on the prospects for success of the "fiscal cliff" circus, and it's a thumbs down.  But truthfully that situation could break either way, and whichever way it breaks is almost certain to lead to a very steep move in the market.  If it resolves bullishly then it's this author's opinion that any bull move is going to be relatively short lived.  The economy is going to continue to be inundated with massive amounts of government debt for the foreseeable future under any of the fiscal cliff proposals being aired, and long run that can only lead to disaster. 

The bull alternate is still alive and well even with Friday's late plunge.  In fact both the bull and bear counts have arrived at the cusp of a potentially explosive move at exactly the same time, which fits nicely with the fiscal cliff background.  However, from an EW point of view the pattern up from the mid-November low into the Dec 19 high is pretty choppy - much more typical of a corrective wave than an impulse - and this would throw the odds to the bear case.

The bull alternate has the ES close to completing an irregular flat 2nd wave, which should lead to a strong and sustained 3rd wave move up.
Bull alternate

There are two ways to view the current bear alternate.  The 1st is as a series of waves 1 & 2 of declining degree since the top of Dec 19, in which case the market is right on the edge of a 3rd of a 3rd wave collapse.  The 2nd is not as immediately bearish.  It has the pattern from the Dec 19 top classified as an almost complete leading diagonal, in which case a wave 2 bounce in the very near future is dictated.
Bear alternate

OR


Sunday, December 23, 2012

Sunday, 12/23/12 update

Last week the ES continued the choppy upside action that's been evident since the mid-November low.  Seasonally equities have an upward bias, and the general trend has been up - but there has been a lot of hesitation along the way.  So the intermediate term picture remains a little obscure.

Last week the bullish EW count had a very awkward looking 5 wave pattern topping with the high on Dec 12.  The action since then has clarified things - the move up from the Nov 16 low into last Wednesday's high now looks to be a leading diagonal 1st wave.  The drop off from there into Thursday evening's mini-crash low was either Minute Wave 2 or Micro wave "a" of Minute Wave 2.     

Bull alternate

The bear alternate has a double zig-zag Minor Wave 2 complete at last week's high.  The sell-off into Thursday's low could be either the start of Minor Wave 3 down or an "X" wave preceding the 3rd and final zig-zag for Minor W2.  The severity of Thursday's mini-crash certainly fits what can be expected in a 3rd wave.  

 Bear alternate

OR


One thing of note on the very short term is the recent behavior of the Vindicator Buy/Sell.  This is a proprietary indicator that measures equity market buying and selling pressure using Advance/Decline and volume statistics.   The notable behavior in this index is the failure of the Buy line to cross below the Sell line during the sell-off of last Wednesday through Friday - this is normally what happens when the market rolls over.  This suggests that there is a higher likelihood of rising prices over the very short term.


Friday, December 21, 2012

Friday, 12/21/12 update

So far today the world hasn't ended, although if you're trading the ES you might feel like it has.

There is an apparent 67 week cycle in equities that this site has been tracking.  As you can see in the charts below, five of the last seven iterations over the last ten years have marked significant long term lows.  It's next due to bottom the week of Jan 7, 2013.  So we could have a wild ride over the next few weeks or so. 


Thursday, December 20, 2012

Thursday, 12/20/12 late update

Updated EW bear count on the ES:


Mayan apocalypse anyone?

Saturday, December 15, 2012

Saturday, 12/15/12 update

Two observations can be made about recent action in the ES:

1) The pattern from the Nov 16 low at 1340.25 into this last week's top at 1438.75 was pretty choppy.  Although a 5 wave count can be deciphered in the pattern it is not clearly impulsive - you have to really work to tease one out of the chart.  If it is in fact an impulse then the intermediate term should be bullish on balance.  The other interpretation of the pattern is that of a double zig-zag, which is a corrective sequence that portends a bear market in progress on the intermediate term (and maybe longer).  

2) The selling from the Dec 12 top has been impulsive with a clear 5 waves down apparent.  Although a bottom of some sort is quite likely at Friday's low, any rally here should be short and quick and should be followed by more selling.  How far that further selling will go depends on whether the bull alternate or the bear alternate is the correct point of view. 

Bear Alternate
Hourly chart

 Daily chart

Bull Alternate
Hourly chart

 Daily chart

Wednesday, December 12, 2012

Wednesday, 12/12/12 update

The EW bear alternate in the ES looks like it completed the 2nd zig-zag up off the Nov 16 low today.  EW rules allow for up to 3 zig zags in a multiple zig zag correction, so it is possible for more rally to occur before the correction is concluded.  Obviously a rally to new highs (only 30 points above today's high) invalidates this alternate.


Sunday, December 9, 2012

Sunday, 12/9/12 update

There are two things that happen with regularity in Washington that just annoy me to no end.  One relates directly to the current market environment and the second doesn't.

So let's take the second one first.  That is a thing called "baseline budgeting".  In baseline budgeting an increase is proposed in federal spending - that new level is termed the "baseline".  Then the politicians propose a reduction in the rate of increase and claim that they have reduced spending!!  As a simplified example lets say that last years expenditures in the Dept of Nonsense were $100 billion.  The Dept of Nonsense then proposes a budget for next year of $110 billion.  The politicians confer and then announce that next years Dept of Nonsense budget will be $105 billion and that they have thus cut spending by $5billion!  Hooray for you oh brave politicians.  What a lying pack of thieves.

The other annoyance is a thing called static analysis.  This refers to a method of analyzing the economic impact of tax policy that assumes a straight line relationship between a change in tax rates and the resultant increase or decrease in tax revenue.  So if tax rates are increased by 10% it is assumed that there will be 10% more revenue gained.  No consideration is given to the thought that people will change their behavior as a result of changes in tax policy.  But it is a historical and provable fact that the more tax rates increase the more people will alter their economic behavior in an effort to mitigate the impact of those higher rates.  This is called dynamic analysis. 

Further, individuals are likely to take steps to avoid higher tax rates that they anticipate will occur.  Which brings us to the current situation in equities.  It appears likely at this point that there will be an increase in tax rates in 2013, to include a drastic jump in the capital gains and dividend tax rates.  So it would seem reasonable to expect people to liquidate assets and book the capital gains in 2012 where the cap gains tax may be significantly lower than in 2013.

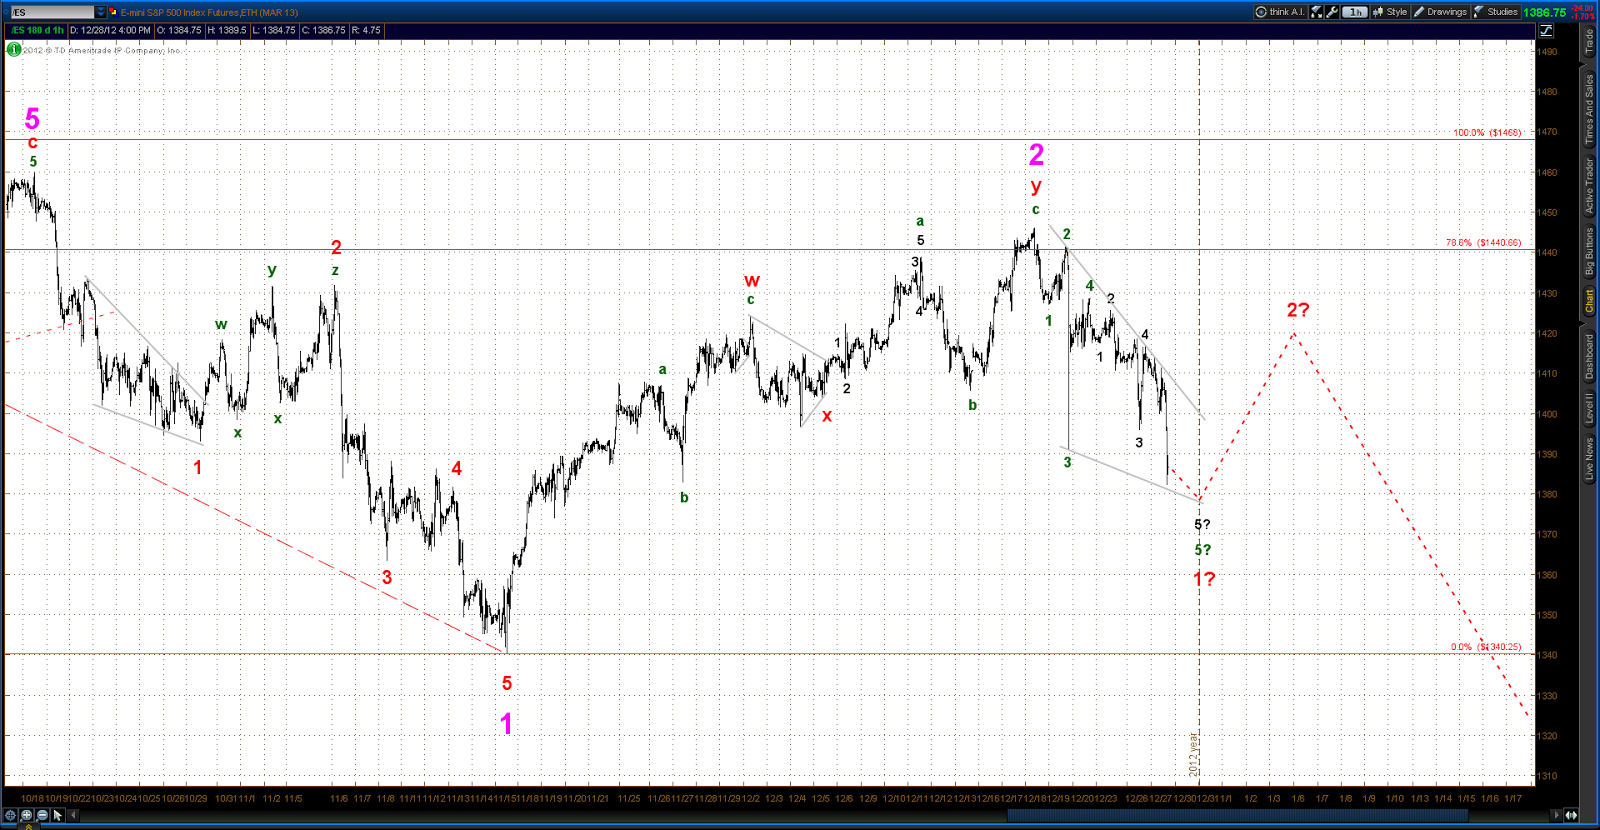
The pattern in the ES/SPX since the Nov 16 low has been much more corrective than impulsive to this point.  Lots of choppiness and wave overlaps.  You get the sense of a bearish undercurrent, and the thinking above may be what's in play.  The bear alternate below translates that bearish looking pattern into a double zig-zag.  Multiple zig-zag corrections can contain up to three zig-zag formations, and since the ES appears to be in the 2nd zig-zag since the Nov 16 low it is allowable for the market to continue to grind out more choppy action with an upward bias for a while yet.  This may be the way that the normal holiday bullish bias gets expressed.

Bear alternate


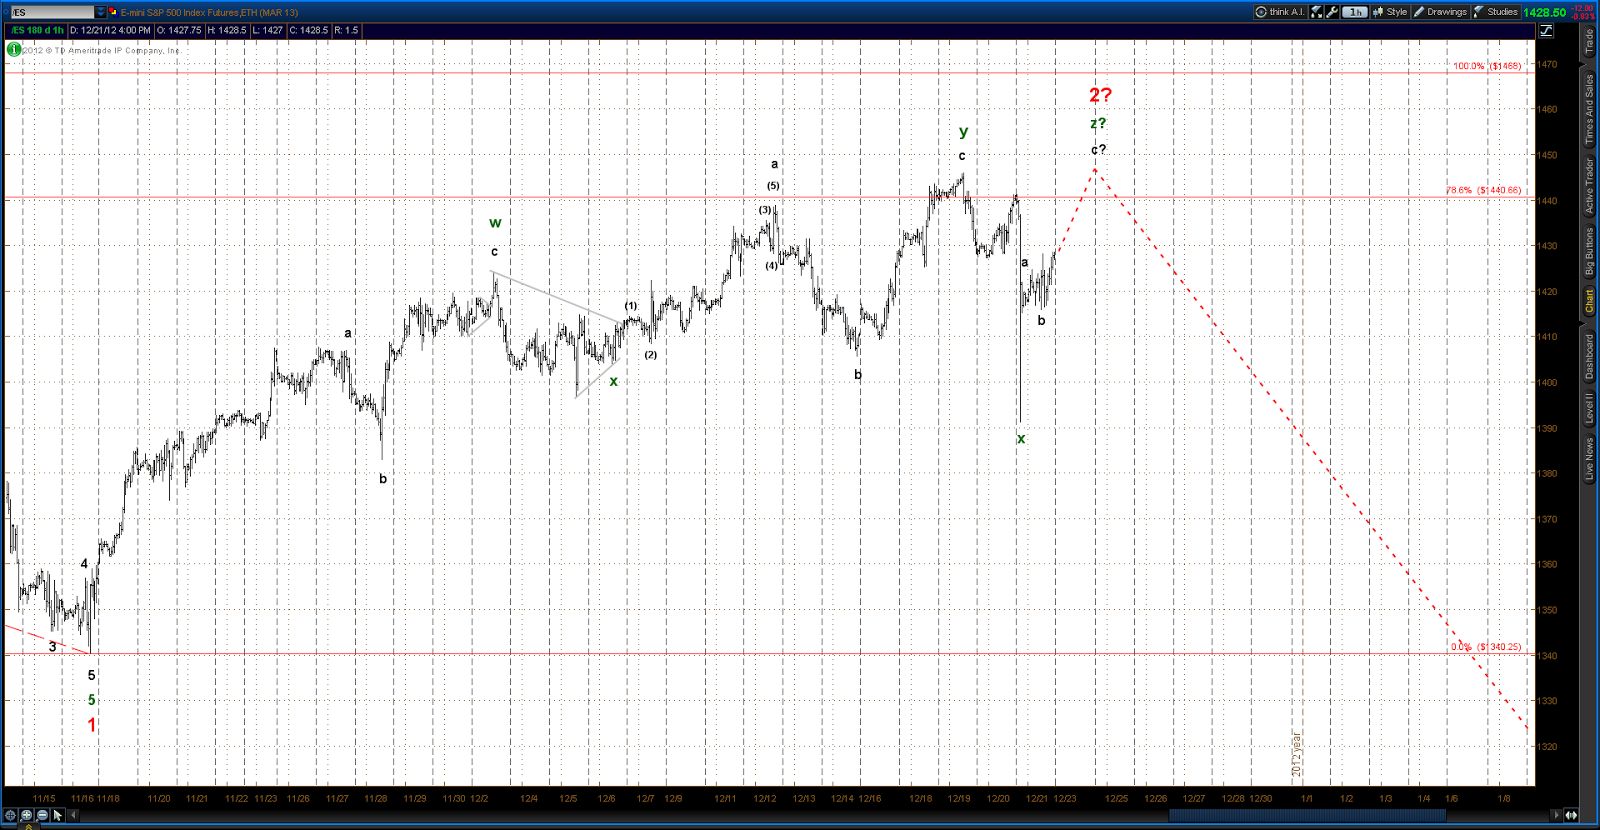
The bullish alternate shows a series of waves 1 & 2 of ever less degree unfolding since the Nov 16 low.  If this is correct than prices should embark on a strong ramp up in a 3rd of a 3rd of a 3rd wave in the immediate future.

 Bull alternate


Sunday, December 2, 2012

Sunday, 12/2/12 update

In the ES/SPX choppy week last week but prices up by the end of the week nevertheless.  The sideways chop of most of Thursday through Friday looks like the market consolidating for another stab higher.  Both the bull and bear alternates appear to confirm this idea, with the ES half way through the second zig-zag off the Nov 16 low in the bear count and  working out a Micro Wave 2 of Minute Wave 3 in the bull count.

Bear alternate

Bull alternate

The question yet to be answered is how far will the holiday rally carry things.  If the ES should rally significantly up past 1440.00 the bear alternate will be in serious jeopardy.