CURRENT CHARTS


Click HERE to view current charts


Tuesday, July 31, 2012

Tuesday, 7/31/12 update

Sell signals have popped up today in all the markets this author trades.

EUR/US$

AUD/US$

GOLD

SILVER

And, of course,

ES

This has been observed often in the past.  The explanation could be the value of the US$, but today the DX is up a little but not that strongly.  More likely the explanation is that which R.N. Elliott discussed: mass psychology.  So the bears are growling at the moment, could be down hard in U.S. equity markets for a bit.

Sunday, July 29, 2012

Sunday, 7/29/12 update

Comments by Draghi (President European Central Bank - ECB)  and Merkel (President Germany) on Thursday and Friday that the European Union will be defended and supported sparked a sharp rally in world markets, including the ES/SPX.  So how do you suppose that will be accomplished?  By issuing more Euros, of course.  And giving those Euros to the profligate countries that are over their head in debt.  Hmm.....

If you or I decide to buy a car and need to borrow money to do it, we make an arrangement with a lender where we sign a promise to pay off the loan over time - that agreement is called a Promissory Note.  To anchor that agreement, the lender will use the car as collateral.  So the collateral is a TANGIBLE  asset - it's a piece of physical property.  
It used to be that if a person was a well known and well heeled bank customer he could get what was known as a Signature Note.  This was a loan who's collateral was the belief, or trust, that the borrower would repay the loan.  In this case the collateral was an INTANGIBLE asset.
Reach into your pocket and pull out a $1 bill.  On it you will see printed "Federal Reserve Note".  So what does that mean?  It means that the money is a promise to pay by the Federal Reserve.  In other words, it's a debt instrument.  But what kind of note is it?  What's the collateral?  It used to be that U.S. currency was ostensibly convertible into a fixed amount of gold, so the collateral was a tangible asset - gold.  But that was ended in the early '70's (thank you Tricky Dick).  So now it's backed by "the full faith and credit of the U.S. government" - i.e. an intangible asset.  Everyone who holds the greenback is essentially trusting that the U.S. is good for the debt.  But who are we trusting in?  Who's ultimately responsible for the promise to pay that our currency represents?  In the end, it's politicians.  Oh, gee, that eases my mind.
However, an argument can be made that the U.S. is a pretty good bet to be good for a debt.  In spite of the economic problems of the recent past we can be viewed as very politically stable in contrast to many other countries around the world, and we are blessed with enormous natural resources and accumulated wealth.  And these are good arguments.  But a counter-argument can be made that these advantages can be overwhelmed by poor management.   Or, more specific to the current situation, poor economic policy on behalf of the Federal government and the Federal Reserve.
Flash back to 2008.  The U.S. economy was swallowed by a housing debt bubble.  Over the top debt based on extremely overvalued collateral.  So how did our esteemed leaders chose to deal with this problem?  Well, by attempting to pump up the economy by borrowing money to inject through enormous government spending programs.  Also, but not less significant, by printing more money (Federal reserve NOTES) - the term is "expanding the money supply".  So we used debt to attempt to solve a problem based on excessive debt.  Kind of like fighting a house fire with a flame thrower.  Prospects for success are limited, to say the least.

So take all this thinking and apply it to the situation in Europe.  It's essentially the same situation as we've been dealing with in the U.S. - a debt bubble which is being addressed by the issuance of more debt.  But complicating things is the fact that the European Union is a voluntary association of separate sovereign states.  Each of those states is governed by it's own group of politicians who are answerable first and foremost to there own constituents and only (very) secondarily to the EU.  Which highlights the critical fault line in the EU arrangement - it's an attempt to unite Europe economically without a political and legal union in place.  And their currency, the Euro, is based on the same shaky foundation and is, like the greenback, essentially a debt instrument backed by the intangible asset of trust in the EU's ability and willingness to pay.  Yes, certainly the Germans have shown themselves to be worthy of trust in this regard, but how about the Greeks? Or the Spanish, the Italians or even the French?  So when Draghi and Merkel say that the EU and the Euro will be supported, can we be sure that their promise will be fulfilled?     

In case you haven't guessed it, it's this author's opinion that the world economy is in some very deep do-do, and the hole is being continuously dug deeper.  So long term the view of this site is decidedly bearish.

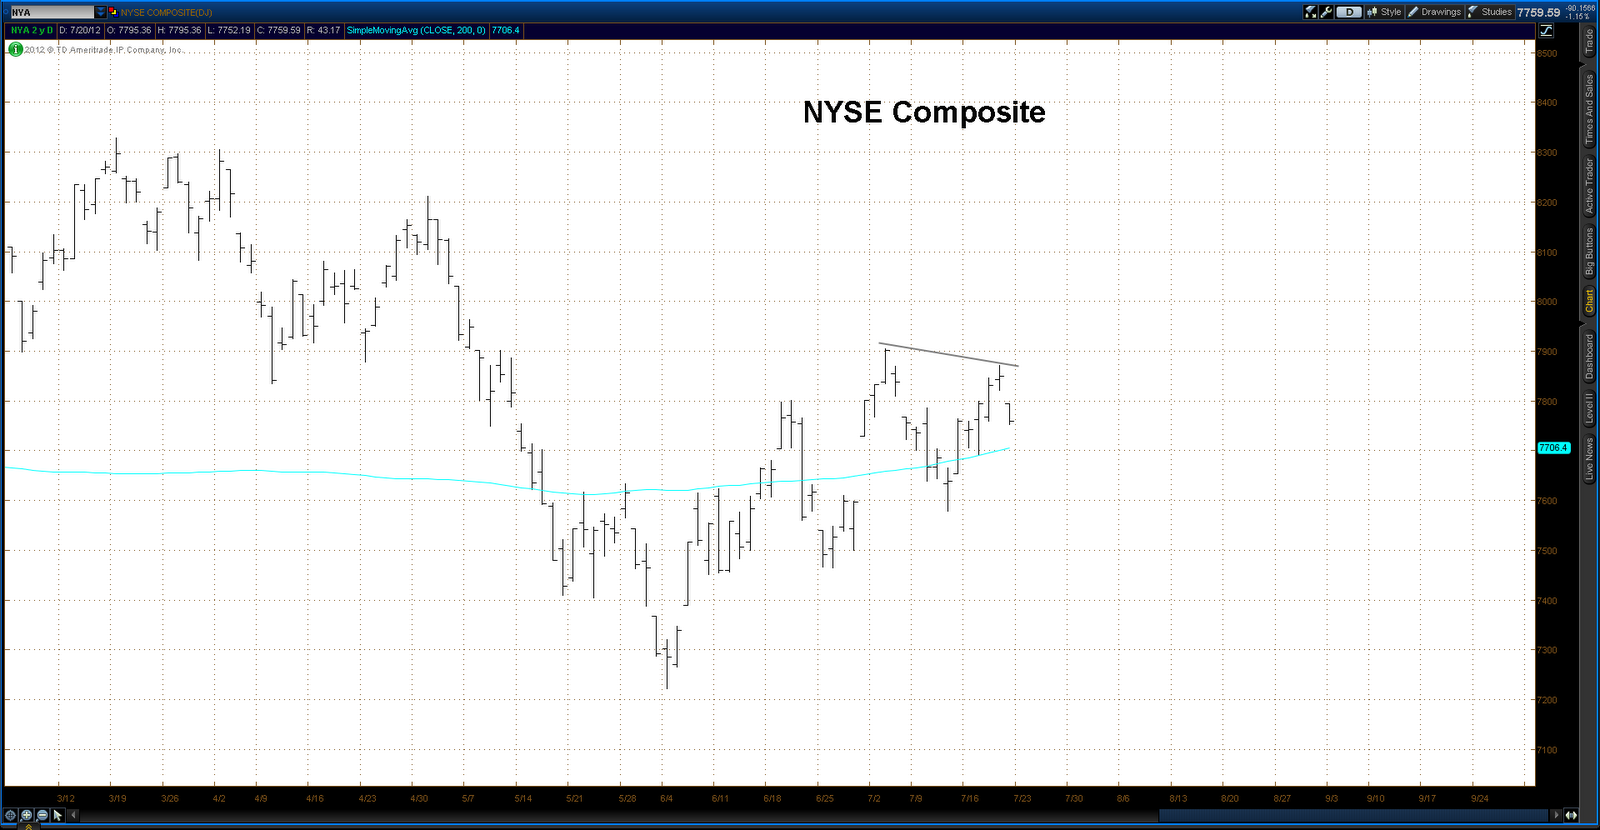
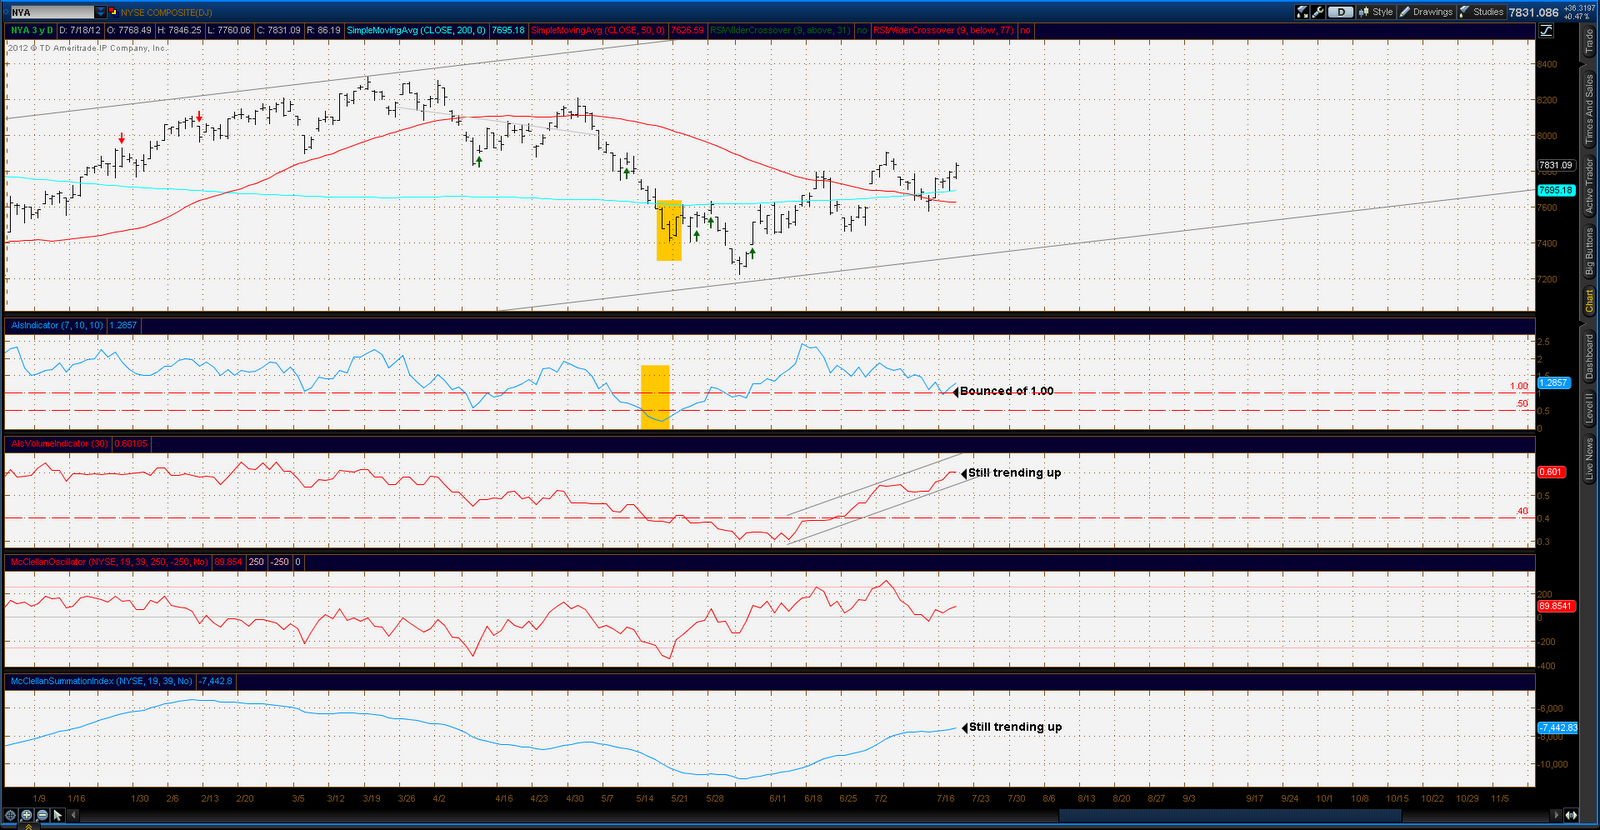
No charts today in this update.  The short version of the current analysis is that we are still in a trading range that's been the case for the last couple of months.  The ES needs to break decidely above or below the limits of that trading range to establish an intermediate term direction.  Interestingly the boundaries are exactly 100 points apart - 1419.75 on the upside and 1319.75 on the low end.  For current in depth EW counts click here to go to the chart section of this site.

Wednesday, July 25, 2012

Wednesday, 7/25/12 update

The IT bear alternate has jumped to the forefront, right now that has to be the more likely possibility.  The sell off from last Thursday into yesterday's lows was clearly impulsive.  In the bear alternate that is currently labeled as a Minute W1.  Minute W2 is thus now in progress, and actually was possibly done today.  However, it's more likely that the correction has a little more time and distance yet to run, if it was complete today it lasted less than a day (against a 3 day+ sell off) and retraced less than .382 of Minute W1.  More likely the corrective bounce has at least another day to run and could easily reach a .50 retrace at ES 1348.50. 


Longer term perspective of the bearish alternate has the ES in the early stages of an Intermediate W3 down:


Monday, July 23, 2012

Monday, 7/23/12 update

Surprisingly, and despite the bearish looking picture, the sell off from Thursday through today's low in the ES did not rule out the bullish EW count.  The low today at ES 1332.00 precisely hit the fibonnaci retracement level of .786 of the prior rally sequence.  Under EW rules a 2nd wave can retrace theoretically down to 1 tick above the low marking the start of the 1st wave, so as long as the market doesn't fall below 1319.75 the bull count, and thus the potential bull market, is still alive.


The market is bouncing off an obvious oversold condition.  This bounce will tell the tale - if it keeps moving up and rally's strongly past the 1376 level then the case for an IT bull market solidifies, if it is just a bounce and soon turns south and down through the 1319.75 level then the IT bear alternate is probably in play.

Sunday, July 22, 2012

Sunday, 7/22/12 update

This site has been leaning bullish on the ES/SPX for a while now but last weeks action brings that into question.  The current bull alternate has the ES in a 3rd wave.   In equities 3rd waves are usually the strongest part of an impulse move.  However the action since the Minute W2 low of 1319.75 on Jul 12 has been somewhat tepid and currently has generated a sell signal.  In addition the whole series since the early June low has been choppy and kind of sideways with an upward bias - not very impressive looking.  Current count on the bull alternate has the ES tracing out a Minute W1 with the top @ 1375.00 on Jul 5, followed by Minute W2, and then a Micro W1 top @ 1376.00 last Thursday.  If this count is to remain viable the ES needs to bottom quickly in Micro W2 and move up from there sharply and in the sustained fashion typical of 3rd waves.

Bullish alternate

The bearish alternate has a better "look" to it at this point - the choppy, sideways pattern since Jun 1 is very typical of a corrective pattern.

Bearish alternate

One factor worthy of note is the lack of participation in Thursday's top in the SPX.  Although the Dow Jones also achieved a high, the broader based indexes such as the NYSE and the RUT did not - so the broader market diverged against the more narrowly based DJIA and SPX.  This is very bearish.


So the bullish case is in real jeopardy here.  Bulls need to take control and turn this thing sharply upwards in the very near future or they could become bear food.

Wednesday, July 18, 2012

Wednesday, 7/18/12 update

The preferred EW count for ES/SPX is intermediate term bullish, and that appears to be playing out.  Current count has a Minute W1 done at ES 1375.00 on Jul 5 followed by a zig zag Minute W2 low at 1319.75 last Thursday Jul 12.  The ES/SPX should now be in Minute W3 and as such should develop into a relatively strong rally.  The patterns since last Thursday's low are very impulsive looking.  A five wave sequence was complete overnight on Monday-Tuesday followed by a very sharp and short correction during regular hours Tuesday morning which in turn was followed by more impulsive looking rally sequences.  This looks and feels like the beginnings of a sustained rally, and very much fits into what can be expected out of a 3rd wave. 


Underlying technicals, although positive, are not overly impressive in terms of total market volumes and daily A/D statistics.  But the longer term bullish count has the ES/SPX in a 5th wave, so "knock off your socks" technicals are not to be expected.  As mentioned, they are positive:  Al's Indicator bounced off the 1.00 line early this week and is now uptrending, the 30 day positive/total volume indicator is continuing to uptrend, the McClellan oscillator is rising off a neutral reading, and the McClellan Summation Index is also continuing to uptrend.


Personal note:  On the road for business the rest of the week, will try to update daily charts when possible

Saturday, July 14, 2012

Saturday, 7/14/12 update

The intermediate term bullish case for equities is still the preferred perspective for this site.  The selling of the last couple of weeks lacked intensity.  Although the market moved lower, the bears never seemed to take firm control, and the rally off the low of last Thursday has an impulsive look to it, although it still needs a 4th & 5th wave to complete.

Market technicals also look bullish.

Internal statistics still show that volume as measured by a ratio of  Volume on up days/Total volume (using a 30 day base) as well as the McClellan  Summation Index are both still in an uptrend.  The McClellan Oscillator has dropped from an overbought reading at the onset of the recent sell off and is now in the neutral area, so it has possibly reset.  (Note: Als Indicator is a mish mash of A/D, volume and momentum statistics used by the author for many years, it works very well as a bottom finder but not so well otherwise).

EW Counts

Bullish alternate
The ES narrowly avoided the 1317 level considered a red flag for the bullish case this week with a low print of 1319.75 on Thursday.  The action since then looks impulsive although it needs a 4th & 5th wave to complete as mentioned earlier.  If this count is correct the ES/SPX should rally strongly from this point.  A rally up past the 1375 high of Jul 5 will help cement the bullish case.

Bearish alternate
The pattern since the Jul 5 top is a little unclear from a bearish perspective.  Best interpretation at this point is for 5 waves down into the Jul 10 low at 1330.50 for Minute W1 with a (very) irregular flat being formed for Minute W2.  On this basis a likely target for Minute W2 is at the .618 retrace of Minute W1 at 1358.00.
ES 1388.00 is the red flag level for the bearish case.


Click HERE to view current charts


Tuesday, July 10, 2012

Tuesday, 7/10/12 update

Today's selling in the ES put in a low of 1330.50 which is right at a couple of fibonnaci levels:  the .618 retrace of the Minute W1 rally from 1302.50 to 1375 is at 1330.25, and at 1329.75 Micro Wave "c" of the three legs since the 1375 top is .786 x Micro Wave "a".  So nice fibonnaci symmetry, assuming that today's low is the extent of the selling and that the market moves up from here.  But the ES is getting perilously close to the 1317 level mentioned in the Sunday update as a red flag for the bull case.  Under Elliott rules the current selling could run all the way down to one tick above the 1302.50 low of Jun 25 and still be a valid 2nd wave, but that scenario is pretty unlikely.  Today's action certainly put the market in an oversold condition, so some type of bounce is warranted in the immediate future.  If the bullish case is valid that bounce should develop into a sustained up move.


Sunday, July 8, 2012

Sunday, 7/8/12 update

Is the glass half full or half empty?  - i.e. is it a bull or a bear market?  I think we'll soon know.

In the bull alternate, the 5 wave impulse off the Jul 25 low @ ES 1302.75 is Minute W1 of Minor Wave "c", with Friday's sell off either Minute W2 or Micro Wave "a" of Minute W2.  Either way the ES should be on the verge of a strong and sustained Minute W3 rally, either right away or within a few days.
If there is further selling from this point a critical level is ES 1317 which is an 80% retrace of Minute W1.  Any time a market retraces greater than 80% of a prior wave the odds of that retrace exceeding the start point of the prior wave go up significantly.  Thus a drop below 1317 is a big red flag for the bulls and would call the bullish count into question.

The bullish alternate has the ES in Intermediate Wave 5 of an expanding diagonal Major Wave C.  As a diagonal each of the five Intermediate waves should have three legs, which is why the Minor waves are labeled with an a-b-c count.


The bear alternate has the ES completing Intermediate W2 or Minor Wave "a" of Inter W2 at the 1375.00 top of Jul 5. That top only being Minor Wave "a" of Inter W2 seems unlikely as the 1375 level is already a fairly deep retrace (71.5%) of Intermediate W1.  If in fact Inter W2 is complete then there should be a strong downside acceleration into Inter W3 in the very immediate future.  Any further rally will bring the 80% retrace level of Inter W1 into view.  That level is 1388.25 and is the red flag level for the bearish case.

Thursday, July 5, 2012

Thursday, 7/5/12 update

Looks like the ES entered correction mode today with a top right at the 1375 level that was anticipated.  In the preferred bull alternate this correction is Minute W2 of Minor W3.  An initial target is at ES 1347.25 which is a .382 retrace of Minute W1 and also the area of Micro W4 of Minute W1 - corrections often bottom in the area of the prior 4th wave of one less degree.


If the sell off gets more serious a level of concern for the bull alternate is at ES 1317, which is the 80% retrace of Minute W1.  A drop below that level would put the bull case in jeopary.

There's a fair chance that this correction could be quite quick.  The RUT (Russell 2000) is a broader based index than the ES/SPX and often leads the ES/SPX.  It has been on a real tear since the Jun 4 low and has actually been significantly stronger than the SPX.  That relative strength is signalling more up market ahead.  Below chart is a comparison of the two, with the RUT in black bars and the SPX in purple.  The indicator below the chart is a simple ratio of RUT/SPX.


Wednesday, July 4, 2012

Wednesday, 7/4/12 update

ES/SPX
In the rally off the Jun 25 low, the ES looks to be in the 5th wave of the sequence.  This would be Micro W5 of Minute W1 under the bullish alternate.  5th waves often equal 1st waves in an impulse, Micro W1 = 26 points, so on this basis starting at the Micro W4 low of 1349.50 there is a target of 1375.50 for Micro W5.

Within Micro W5, Nano W1 = 11 points, so applying the same analysis then starting at the apparent Nano W4 low of 1363.75 a target for Nano W5 is 1374.75.

So the ES 1375 area could provide strong resistance and turn the ES lower.

EQUITIES vs CURRENCIES
The European troubles are certainly an influence on US financial markets.  A lot of folks like to keep a sharp eye on the Euro and US$ for clues to US equity trends.  The prevailing theory is that the US$ is inversely related to the ES/SPX and the Euro is thus positively correlated.  And that is true from time to time on a very short term basis.  But it might be good to examine the next two longer term charts and ask if that's true in general, and also whether it's a reliable approach to trading decisions.