CURRENT CHARTS


Click HERE to view current charts


Saturday, June 30, 2012

Saturday, 6/30/12 update

For some time now this site has been tracking two EW counts for the ES/SPX that are diametrically opposed on the intermediate term - obviously one bullish and one bearish.  It's been difficult to get a sense of which is the correct view, especially since the top in late March.  However, the picture has clarified considerably as of late, especially with the events of late last week.
 
The bearish view has a lot of appeal, and in fact both the alternates considered viable envision an eventual top at or near the 2007 highs followed by a long term and very significant bear market.  There is no question that the world economy is teetering on the edge of a debt driven financial implosion.  The question that's yet to be answered is when will that implosion commence.  The intermediate term bearish alternate actually indicates that implosion will happen later than indicated by the intermediate term bullish alternate.
 
And it's the intermediate term bullish alternate that seems much more likely at this juncture.  There are both fundamental and technical arguments of some strength for this view.

From a fundamental perspective, the most significant consideration is the political one.  It is an election year, and the powers that be will most certainly do all they can to keep the (leaking) economic boat afloat.  They'll even give it a fresh coat of paint if they can.  Consider: late last year Congress and the White House agreed to put off the expiration of the Bush tax cuts until after the November elections.  Consider: most of the new taxes in Obamacare don't kick in until after the election.  Consider:  at the FOMC meeting the week before last it was decided to expand and extend Operation Twist, thus providing more liquidity to soak up the Federal debt.  The list could go on, but you get the picture.  The second significant factor is the EU agreement of last Thursday.  Although the success of that pact is highly questionable - to succeed it will require economically sound policies to be enacted by European politicians in troubled countries (fat chance) - it will serve to take the Euro troubles off the radar.  For a while at least.   Witness the explosive rally Friday - the European situation has been a major weight on the market, and the appearance of a resolution certainly sparked a significant reaction.

There are a number of things to look at from a technical perspective.

First up is a simple study that looks at volume.
The indicator is based on the NYA.  It's a simple ratio of the sum of the volume on up days divided by total volume over the period chosen.  A 30 day base gives some pretty good intermediate term signals.  A ratio below .40 indicates oversold and above .70 indicates overbought.  As can be seen the indicator bottomed below .40 right at the June 4 low and has since turned solidly up.

Second is the McClellan Summation Index.
For those not familiar with it, the Mclellan Summation Index is a running total of McClellan Oscillator readings for the time period in question.  The McClellan Oscillator is based on moving averages of advance/decline statistics.  So in essence this is a read on the underlying market trend in terms of advancers vs decliners.  As in the earlier volume study the McSI oscillates between overbought and oversold.  Also as in the first study this indicator bottomed right at the June 4 low and has trended solidly upwards since that time.

Next is a momentum study called the Trendline/Oscillator System.
 The Trendline/Oscillator System is an approach developed by the author several years ago which has proven valuable.  In the Trend/Osc a buy signal occurs when prices close above a downtrend line accompanied by a break above 20 in the momentum oscillator.  (A sell signal triggers with a close below an uptrend line and an oscillator read below 80).  The system can be applied to any time frame.  Applying it to a daily chart gives a fairly reliable intermediate term read.  As can be seen, that system signaled a buy  on June 18 when the ES closed above a downtrend line drawn from the May 1 high (the oscillator had already broke above 20 on June 6).

So the underlying technicals - volume, adv/decl and momentum are all pointing up.

The intermediate term EW bullish alternate looks like this:

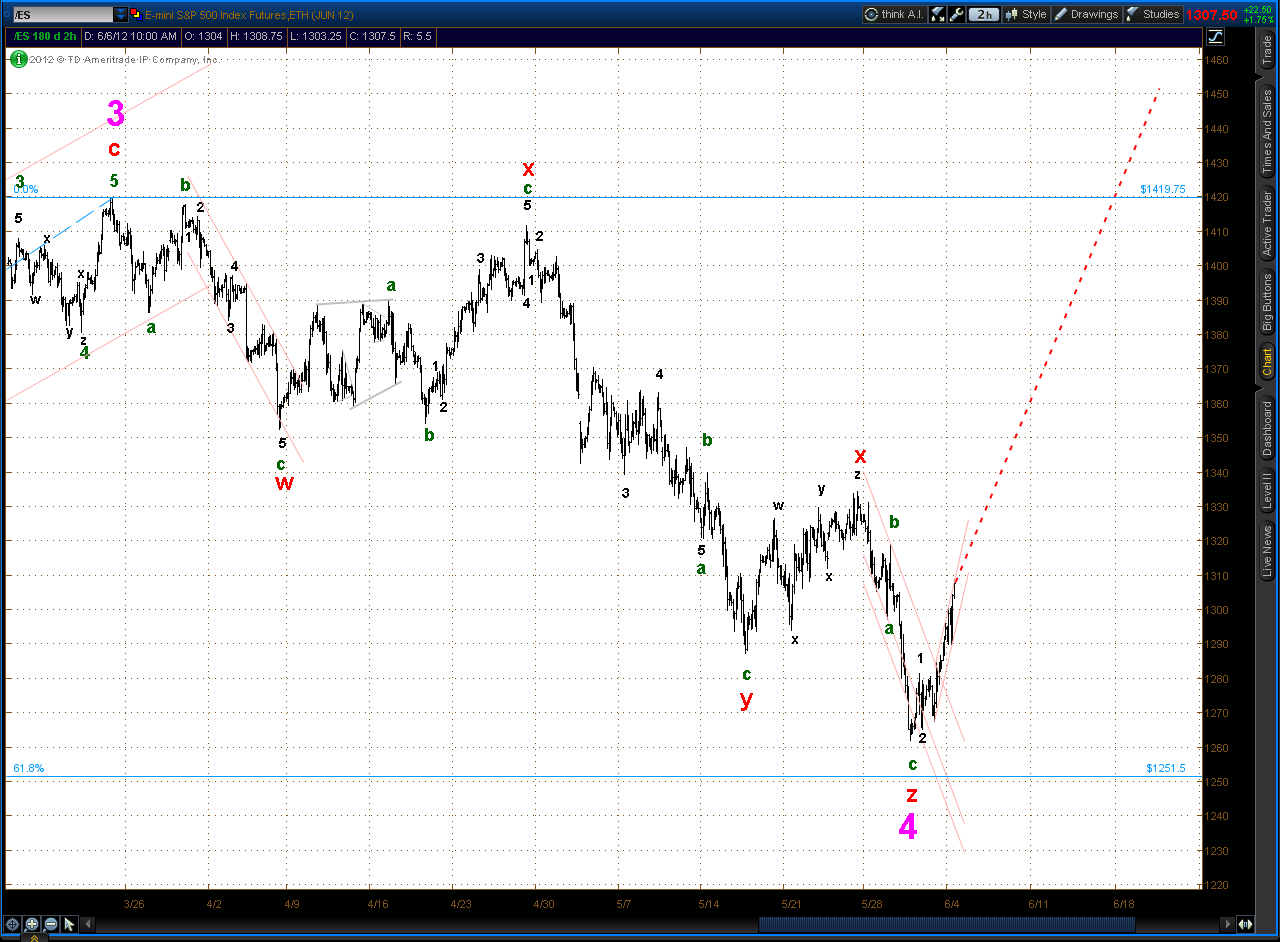
The ES has been forming a double zig-zag Primary Wave structure since the Cycle Wave low of 665.75 in Mar '09.  Double and triple zig-zags consist of two or three 5-3-5 zig-zag structures which are labeled "W', "Y" and "Z" and are separated by one or two 3 wave structures called "X" waves.  So a triple zig-zag is labeled W-X-Y-X-Z.   In the series since the March '09 low the first zig-zag, Primary Wave W, concluded with a high of 1216.75 in April, 2010.  The following Primary Wave X bottomed at 1002.75 in July, 2010. Primary Wave Y has been unfolding since that time.

Major Wave A of Primary Wave Y ended with a high of 1343.00 on Feb 18, 2011. Major B followed and took the form of a 3-3-5 irregular flat type formation which concluded with the low of 1068.00 on Oct 4.  Major C has been in progress since that time.

Major Wave C should be a 5 wave structure with 5 Intermediate waves. Since it is the last wave in the Primary C structure it can take the shape of an ending diagonal per EW rules, which is what it is doing.  In an ending diagonal each wave has an a-b-c form.  This would include waves in the direction of the trend.  Also, wave 4 should overlap wave 1 and both waves 2 & 4 should be zig-zag type corrections.

Intermediate Wave 1 topped on Oct 27 at 1289.25.  Intermediate 2 followed with a double zig-zag formation that retraced a little over .618 of Intermediate 1 and bottomed at 1147.50 on Nov 25.  Intermediate 3 ended at a high of 1419.75 on Mar 27 and has a clear a-b-c structure.  Intermediate W4 appears to have bottomed at 1262.00 on Jun 3.  It took the form of a triple zig-zag.  Also, the low at 1262.00 overlaps the Inter W1 high of 1289.25 which helps cement the argument for an ending diagonal.  Intermediate W5 is now in progress.

The top of Intermediate W5 is extremely important.  It will mark the conclusion of Major Wave C of Primary Wave Y of the entire bull move off the March '09 lows.  In this scenario that would conclude a Cycle degree X wave and usher in the onset of a pretty serious bear market.  That bear should be the equal of the 2007 - 2009 bear.

Targets that seem possible at this time are 1578.50 where Major Wave C = 1.50 x Major Wave A and 1594.00 where Intermediate W5 = 1.50 x Intermediate W1.  These are right in the area of the 2007 high at 1586.75.

Finally, this is what the intermediate term bearish alternate looks like:

Tuesday, June 19, 2012

Tuesday, 6/19/12 update

ES wave counts:

Bull alternate

Bear alternate

Saturday, June 16, 2012

Saturday, 6/16/12 update

A week ago in the update I complained about the lack of divergences at the June 4th low and the resulting difficulty in determining the likelihood of either the bull or bear case.  At the time I was referring to hourly charts and associated indicators.  However, yesterday while reviewing a daily chart of the ES it was obvious that clear momentum divergences did in fact occur at that June 4 low.  Don't know how that was missed until just yesterday, but they are there and pretty hard to ignore.  The other thing that pops out on the daily chart is that on Friday the ES closed right at the downtrend line that defines the drop down from the high of May1.
So right now the bull case has to move into the preferred column, and a close above the downtrend line in the near future would boost the probabilities of a sustained bull even higher.


Bull alternate

Bear alternate

Thursday, June 14, 2012

Thursday, 6/14/12 update

Possible bear count for ES.  Note that 1359.50 is a .618 retrace of Intermediate Wave 1 (purple) and 1360.00 is a .786 multiple of Minor Wave A (red). 
The other thing to note is that Intermediate W1 took 9 1/2 weeks to unfold, this projection shows a top for Intermediate W2 only 2 weeks from it's onset, a bit quick.  So if this is accurate in terms of form, the projected top around 1360 may only represent the 1st leg of Intermediate W2.  In that case the labeling of Intermediate W2 would drop down by one degree and it's eventual conclusion would be pushed forward in time.


Zoomed in


Sunday, June 10, 2012

Sunday, 6/10/12 update

This is one of those difficult junctures for a technician, or at least this technician.  There are two very plausible and diametrically opposed alternates right now.  Usually there are underlying technical indications to lean on in determining which alternate is more probable.  And in fact, those technicals seem to support the bullish case, but there is a problem.  There are a number of momentum, adv/dec and volume based metrics which normally show divergences at significant market bottoms.  Those tools did not show their typical divergent patterns at the ES low of Jun 3.  So is that telling us something?  They don't have to diverge, but if the bull alternate is in play it will do so with kind of an unsettled kick off.  Of course, if the bear alternate is correct, than the lack of divergences would be expected.  Won't know the answer definitively for a while.

Bear Alternate 
Daily Bars

Hourly Bars
(note: Minor W1 (red numerals) in this count is a leading diagonal)

Bull Alternate 
Daily Bars

Hourly Bars

Thursday, June 7, 2012

Thursday, 6/7/12 update

I'm afraid I may have thrown some folks off with yesterday's update.  The ES count presented there was an ALTERNATE count, the PREFERRED count is below.  Coming into this week it looked like the odds were 75/25 preferred to alternate, but with the action this week I believe we've shifted to something like 55/45 preferred to alternate.
Hourly count on the preferred has the ES in a minor W4 (red numbers) to the drop from the Mar 27 high.  Minor W2 was a simple zig-zag, so Minor W4 needs to be a flat, triangle or some sort of complex structure.  Unfortunately the point at which a rally would invalidate this count under Elliott rules is at the bottom of Minor W1 (red), which is way up at 1386.25.  However, as a practical matter a continuation of this rally with enough steam to bring those levels into view would make this count dubious.
Projections on the chart are just to show possible form, they are NOT intended as price predictions.

Preferred count - 2 hour bars


Preferred count - Daily bars

Wednesday, June 6, 2012

Wednesday, 6/6/12 update

Pretty stout move up has developed off the Sunday night lows.  Alternate #2 presented in recent weeks (see Sunday post) has to be given strong consideration at this point.  The drop from the late March highs into the recent low at ES 1262.00 can be counted as a triple zig-zag.

 
Longer term view has the ES in an ending diagonal C wave off the lows of last October with an eventual target around the 2007 highs.


Zoomed out


Tuesday, June 5, 2012

Tuesday, 6/5/12 update

Best guess on current ES wave count is Micro W4 still in progress and is a double zig-zag:


However the duration of this Micro W4 is now twice as long as Micro W2, so prices need to roll over almost immediately.  In Elliott this count is not invalidated unless prices move above the low of Micro W1 at 1305.25, but realistically if the ES rally's up past that spot it's almost certain that Sunday night's low at 1262 was more significant than thought.  Adding to the case for a change in trend is apparent trend changes from bear to bull in the EUR/US$, AUD/US$, Gold & Silver (see "Market Trends" to the right).  All these markets have tended to move in unison in the recent past, mainly because the value of the US$ is a driver in all of them.

Monday, June 4, 2012

Monday, 6/4/12 update

Updated ES count.
Price action today looks like Micro W4 correction to Minute W5 down from the 1334.25 high of last Tuesday. Micro W4 looks to be a triangle so far although it could morph into something different before it's over.  It should conclude overnight or tomorrow and then roll over into Micro W5.  Dotted lines in chart are intended to show possible trajectory, they are not hard predictions of price levels.


Saturday, June 2, 2012

Sunday, 6/3/12 update

ES/SPX
The ES is in a strong downtrend which does not appear over, although a bounce in the very near future would not be a surprise.  From an EW standpoint, the selling that started at the close last Tuesday looks like three waves through EOD Friday, with the 3rd wave possibly done or very close to done.  This would portend a wave 4 & 5 before a more serious bounce or change of trend.  Momentum indicators are oversold on an intraday basis but not quite oversold on a longer term time frame which supports the EW analysis.
60 minute bars

5 minute bars

Two alternate counts seem the most likely at this point.

Alternate #1
Daily

Hourly

Alternate #1 has to be the preferred count right now given the precarious situation in Europe and the evidence of another looming recession in the U.S.  The ES/SPX and other U.S. equity indexes are certainly supporting this alternate with the impulsive looking wave structures that have been expressing themselves since the top of late March.  If this alternate plays out the ES should be steady down for some months to come with an eventual low around the ES 1000 area.
The current count here has the ES closing in on the low of Minor W3 (red) of Intermediate W1 (purple).  The bear move should have 5 Intermediate waves, so the ES is in the relatively early stages of the sell off.  If this is correct, there will be a Minor W4 correction followed by Minor W5 down before a more significant bounce can be expected.

Alternate #2
 Daily

Hourly

Alternate #2 says that the ES is in a large ending diagonal structure that commenced with the low at 1068.00 early last October.  An ending diagonal is a 5 wave structure where wave 4 overlaps the top of wave 1, which has occurred on May 21 and then again on Friday last week.  Each wave should be a three legged structure, and that is evident in all 4 waves so far.  Also, there is a nice piece of symmetry in this count: Intermediate W2 (purple) was a double zig-zag and Intermediate W4 also appears to be a double zig-zag.  If the current count for this alternate is correct then the ES is in the last stages of Intermediate W4.  Target area for the W4 low is in the mid-1200's.
This ending diagonal would be the last move in the longer term structure dating back to the post-crash lows of March '09.  As such it's conclusion would portend some pretty serious bear market action. 
So the major difference between Alternate #1 and #2 is a matter of timing, they both would result in major damage to equity prices, but Alternate #1 says "happening now" and Alternate #2 says "happening a few months down the road".

ES 1269
ES 1269 has a good possibility of providing significant short term (1 - 2 weeks) support to prices.  First, it is the point at which Minute W4 (green) = Minute W1 in Alternate #1.  Second, it shows up as a "volume hole" in a 6 month volume profile study of the ES.


Volume holes are price levels where noticeably less contracts have been traded during the time frame of the study.  As such they provide an indication of a price level where significant support/resistance may be located - if relatively less contracts have been getting traded at a certain price point it follows that prices have been bouncing off that price point.  As with any market analysis tool this is not a 100% deal, notice how prices sliced down through an apparent volume hole at 1293.75 on Friday (although there was a small hesitation at that level).

Gold
Gold looks very likely to have finally established the bottom to the the Major Wave 4 correction to it's bull market run that started in Oct '08.  If so it's in the very early stages of Major W5 of that run and thus should match the Major W3 high of 1923.70 at a minimum.  In commodities the 5th wave of a sequence is usually the strongest as opposed to equities where the 3rd wave is expected to have the greatest strength.  Thus there's every possibility that gold will exceed the $1060 gain of Major W3, which would give a potential target of $2600/oz or better.  Whoa Nelly!!!

Daily

Hourly

If gold is in fact embarking on a some serious price appreciation that would support the case for the ES Alternate #1.  Severe equity bear market = fear = higher demand for gold.

Friday, June 1, 2012

Friday, 6/1/12 update

Current ES wave count