CURRENT CHARTS


Click HERE to view current charts


Wednesday, December 21, 2011

Wednesday, 12/21/11 update

As usual there are a bunch of possible alternate Elliott counts for the ES at this juncture. One that bears watching has a triangle being formed since the early October lows. If true, the ES is in the final "e" wave of the structure. When concluded, prices will roll over into a bear market situation. This alternate has a much lower probability of others IMO, and can be ruled out if the ES significantly penetrates the upper trend line of the triangle in the 1260 area.

Monday, December 19, 2011

Monday, 12/19/11 update

The Elliott pattern since the Dec 8 top looks like a triple zig-zag into today's low and very possibly is done at that low. If so it was an almost exact .618 retrace of the rally from Nov 25 into Dec 8.

Three possible Elliott counts at the moment:
Alternate 1

Alternate 2

Alternate 3

Friday, December 16, 2011

Friday, 12/16/11 update

Pattern since yesterday's low looks corrective rather than impulsive, closed long ES for now.

Thursday, December 15, 2011

Thursday, 12/15/11 update

Possible ES wave count. Went long ES, 1/2 position.

Wednesday, December 14, 2011

Wednesday, 12/14/11 update

Went long ES, 1/2 position, stop @ low today @ 1206.25, could get my butt shot off but worth a flyer (heavily oversold)

Tuesday, December 13, 2011

Tuesday, 12/13/11 update

What the ............... was that? Didn't expect the drop today. Possibly we're seeing a triple zig zag Minor Wave 2 from the Dec 8 top as per the chart below. The other possibility is that the pattern since last week's top is a series of waves 1 & 2 of a developing downtrend, which would portend some pretty serious bear activity in the very immediate future. Haven't worked up a chart for that.

A close above the downtrend line on the below chart would be a first indication of a bottom being in place and a resumption of the up trend that started on Nov 25.

Saturday, December 10, 2011

Saturday, 12/10/11 update

It's nice to get something right once in a while, so forgive me if I boast. The chart below is the chart presented on the Thursday update, red dotted line is my projection. As you can see, the ES read the memo and followed instructions. Right.

On to reality. Two most likely possibilities for the coming week are first, a continuation of a Minor Wave 2 correction that started at last Thursday's high or second, Minor Wave 2 was complete at the early AM Friday low and it's up, up and away in Minor Wave 3.

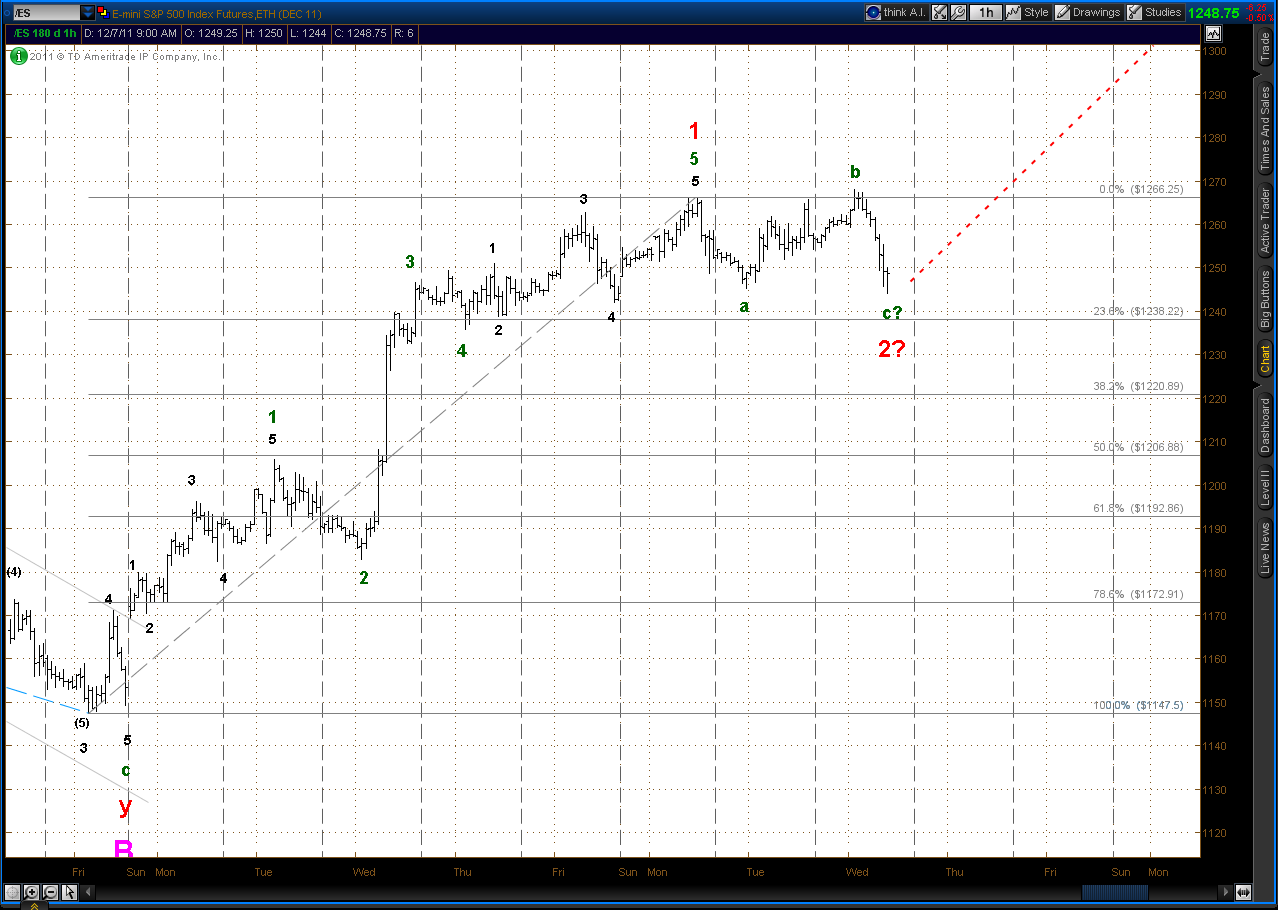
Alternate 1 - Minor W2 continues

Alternate 2 - Minor W3 in progress

The coming week is December options and futures expiration week, those weeks have a bullish tendency. Also, the European deal struck Friday should lift some bearish sentiment off the market, at least temporarily (that is, until everyone realizes that it's a positive in the long run, but in the short run there is still a lot of European overspending and excessive debt). Finally, December tends bullish on a seasonal basis. So the edge has to go to Alternate 2.

One other note on charting the ES. The Minor Wave 1 labeling at the print high on Thursday looks odd on the charts, but it's because TOS rolled from the December to the March contract on Wednesday evening. This can be a problem with applying Elliott Wave to futures markets continuation charts.

The fix is to examine a non-continuation chart for the next monthly expiration in the series to gain clarification. As you can see, the proposed Elliott count doesn't look quite as odd if it is applied to a chart of the March expiration ES:

Thursday, December 8, 2011

Thursday, 12/8/11 update

Just when you think you've got it nailed, surprise!!

Possible ES Ellliott count:

Wednesday, December 7, 2011

Wednesday, 12/7/11 update

Looks like a flat type correction, possibly done at the low a little bit ago. Nibbled at a long ES position with a tight stop (stop @ today's low), we'll see if it works.

Tuesday, December 6, 2011

Tuesday, 12/6/11 update

Sell signal on 10 minute SPX/Vindicator. Not going to trade this, looking to go long near the bottom of what could well be just a Minor Wave 2 correction. See ES Elliott count in 2nd chart.

Saturday, December 3, 2011

Saturday, 12/3/11 update


The low on Friday Nov 25 was just a tad past the .618 retrace of the October rally.
The pattern off the low of Nov 25 has been clearly impulsive and quite powerful: 115 points up from 1147.50 (= 10% gain!) to the high of 1262.75 on Friday - just 5 days. Five waves can be counted into Friday's high, that high is being tentatively labeled as a Minor W1. Minor W2 is likely to be a shallow retrace given the power of the uptrend so far. A .236 retrace of Minor W1 is 1235.50 which is almost exactly the low of Minute W4 of Minor W1. The .382 level is at 1218.75, which is in an area that has been important resistance/support in recent months.

Updated daily charts of the two most likely alternates:

Alternate 1

Alternate 2

Wednesday, November 30, 2011

Wednesday, 11/30/11 update

Of the three alternate ES/SPX scenarios presented Saturday, the 3rd and most bearish one (near term) has been ruled out by the action so far this week. That leaves the idea of a intermediate term flat in progress since the highs of last May, or a more bullish Major Wave C up off the early October low at 1068.00. In the flat alternate, prices should trend up to the early May highs around 1375 over the next month or so, and then roll over into some serious selling for the C wave of the flat. In the 2nd alternate, a longer term bull trend is in effect which will eventually lead to the area of the 2008 highs.

Alternate #1

Alternate #2

Saturday, November 26, 2011

Saturday, 11/26/11 update

The selling in the SPX/ES since mid November has certainly been relentless. Wave count on this extended impulse does show that the sequence is possibly nearing a conclusion, although at least one more wave 4 - 5 sequence is indicated. Prices are currently working in the area of a .618 retrace of the October rally at 1152.50. It is quite possible to see prices stay in this area for a few days while putting in the final waves. If prices do push lower in the immediate future then the next level of support is at the .786 retrace of the October rally at 1115.25.

Updated charts on the alternate longer term ES counts:

Alternate 1

Alternate 2

Alternate 3

Given the relentless nature of the recent selling, Alternates 1 & 2 are beginning to fade in probability. This will be especially so if prices push down to that .786 retrace of the October rally at 1115.25. Both those alternates will be completely invalidated if the ES drops below the Oct 4 low of 1068.00.

Wednesday, November 23, 2011

Wednesday, 11/23/11 update

Ouch - got my fingers burned. Long ES trade yesterday looked like a good move from half a dozen standpoints, but obviously it wasn't.
Buy signal on the SPX/Vindicator 10 minute chart was a bad one, but what should be noted is that there was not a buy signal on the the SPX/Vindicator 30 minute chart - lesson here is that the longer term trend was still down so the trade based on the 10 minute chart was against that trend - i.e. it was a trade that fought the tape, never a good idea.

SPX/Vindicator 30 minute
It should be noted that there is a divergence in the Vindicator sell line against these lower prices, so the strength of the selling appears to be waning, but it's still not over yet.

SPX/Vindicator 10 minute chart as of a little while ago:

The Elliott pattern in the last few weeks is quite interesting. Especially last week Wed (11/16) through Fri (11/18). Those few days had multiple overlaps - every corrective move up against a prior down thrust overlapped the prior sequence. There were four of those in the space of three days. The options with that were to view them as a series of waves 1 & 2 or as an unfolding ending diagonal. The ending diagonal seemed more likely, and that was my count yesterday, but price activity since then has ruled that out. What is apparent now is that last weeks overlapping was in fact a series of waves 1 & 2 marking the onset of an extended down impulse. We thus should see a sequence of ending waves 4 & 5 over the coming days.

The .618 retracement level of the October rally is at 1152.50, and at 1157.50 Minute Wave "c" is twice Minute Wave "a", so target levels for this sell off are in that area.

If we push significantly below that, then the most bearish medium term option of the three that have been getting presented increases in probability. And if we break below the early October low at 1068.00 then it becomes a certainty.

Tuesday, November 22, 2011

Tuesday, 11/22/11 update

Buy signal on SPX/Vindicator, went long ES.

Elliott pattern on the ES has been very difficult as of late, but it looks like the correction that's been in progress since Oct 27 could well be over as of today's low at 1179.25. A 50% retrace of the October rally is at 1178.75, pretty doggone close to today's low.


Sunday, November 20, 2011

Sunday, 11/20/11 update

Daily charts for the ES of the three possibilities that are being followed. First two are the more likely alternates given seasonal tendencies. For more details on these alternates click HERE.

Fourth chart below is of the EURO/US$, which is pertinent given all the European troubles that have been affecting markets.


If the below count on the EURO/US$ is correct, we could see a multi month bull move in that currency pair. That would be bullish for the ES/SPX.

Wednesday, November 16, 2011

Wednesday, 11/16/11 update

Update on three possibilities from Monday's post.


Tuesday, November 15, 2011

Tuesday, 11/15/11 update

Buy signal on the ES/SPX. I'm inclined to go long, but there is a real danger of whipsaw here, so holding off pending a pullback. If there is a decent pullback, will need to assess it before committing.

There's been a developing triangle since the high of Oct 27. That triangle quite possibly completed it's final "e" leg at this morning's low, although it didn't reach the lower triangle trend line around 1225. So the question is, will there be just a little more selling to bring prices closer to that lower trendline?

Monday, November 14, 2011

Monday, 11/14/11 2nd update


SELL SIGNAL ON SPX/ES

Monday, 11/14/11 update

There are three possibilities on the ES at the moment. There are good arguments for and against each one, so it's real tough to say which is more likely.


Friday, November 11, 2011

Friday, 11/11/11 update

Buy signal on the Vindicator Buy/Sell, but not going to trade this as it looks like the underlying trend is down.

Fascinating fractal pattern in last 6 weeks: double zig-zag from low of Oct 4 to top of 10/27; triple zig-zag from low of Nov 1 to top of Nov 8; and apparent double zig-zag in progress the last couple of days. Elliott theory says moves with the trend are in 5 wave structures and against the trend are in 3's - so underlying trend appears to be DOWN.


Target area on this zig-zag formation is around 1260, which has been support/resistance in recent weeks.